French vs U.S. Virgin Islander Family Households
COMPARE
French
U.S. Virgin Islander
Family Households
Family Households Comparison
French
U.S. Virgin Islanders
64.0%
FAMILY HOUSEHOLDS
23.7/ 100
METRIC RATING
193rd/ 347
METRIC RANK
62.6%
FAMILY HOUSEHOLDS
0.0/ 100
METRIC RATING
291st/ 347
METRIC RANK
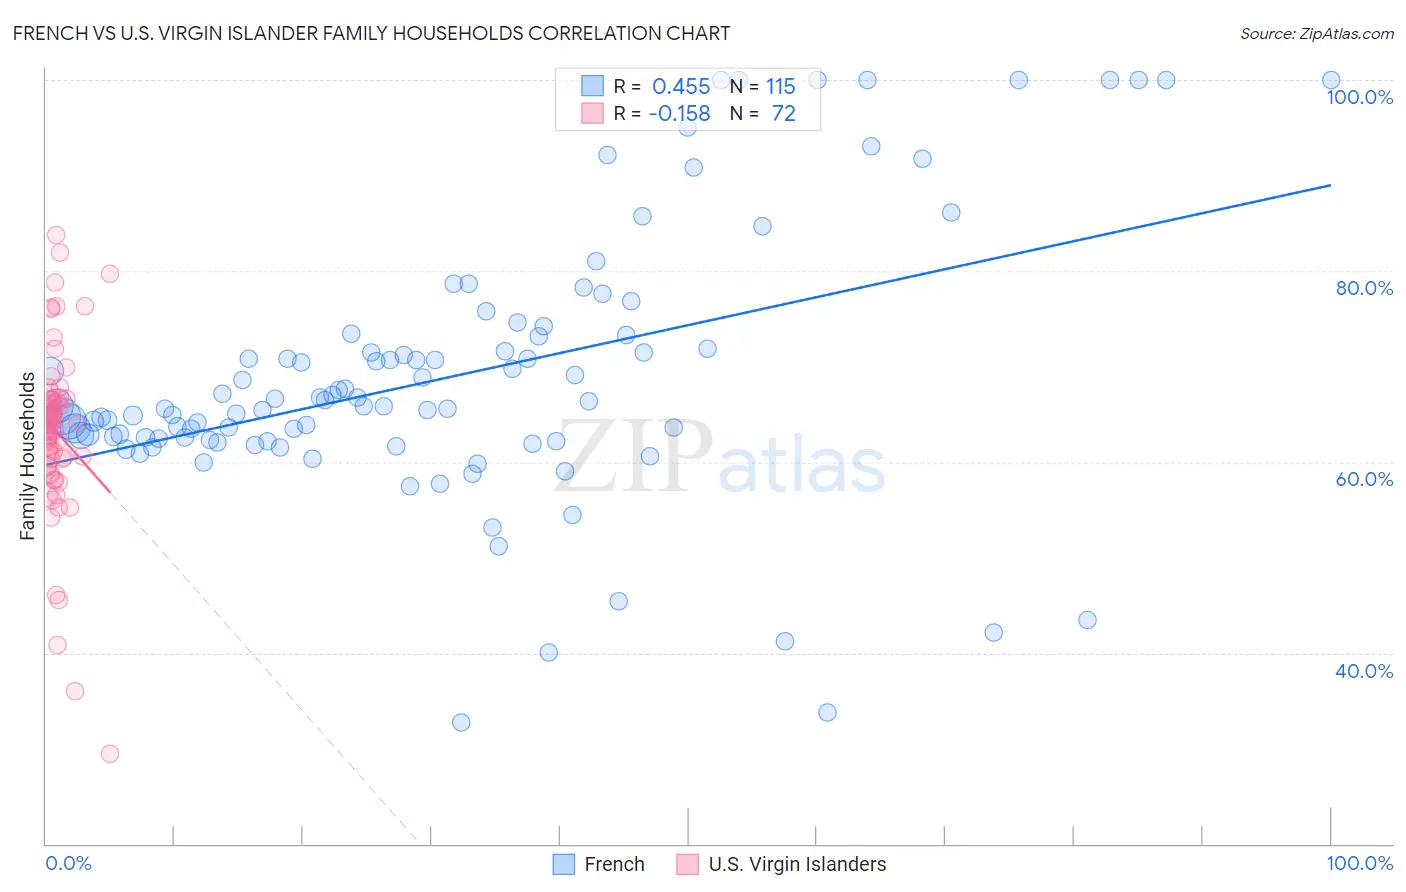
French vs U.S. Virgin Islander Family Households Correlation Chart
The statistical analysis conducted on geographies consisting of 571,815,050 people shows a moderate positive correlation between the proportion of French and percentage of family households in the United States with a correlation coefficient (R) of 0.455 and weighted average of 64.0%. Similarly, the statistical analysis conducted on geographies consisting of 87,507,759 people shows a poor negative correlation between the proportion of U.S. Virgin Islanders and percentage of family households in the United States with a correlation coefficient (R) of -0.158 and weighted average of 62.6%, a difference of 2.3%.
Family Households Correlation Summary
| Measurement | French | U.S. Virgin Islander |
| Minimum | 32.6% | 29.5% |
| Maximum | 100.0% | 83.8% |
| Range | 67.4% | 54.3% |
| Mean | 68.9% | 63.2% |
| Median | 65.8% | 63.9% |
| Interquartile 25% (IQ1) | 62.3% | 59.9% |
| Interquartile 75% (IQ3) | 73.1% | 66.5% |
| Interquartile Range (IQR) | 10.8% | 6.6% |
| Standard Deviation (Sample) | 13.9% | 9.1% |
| Standard Deviation (Population) | 13.9% | 9.1% |
Similar Demographics by Family Households
Demographics Similar to French by Family Households
In terms of family households, the demographic groups most similar to French are Lithuanian (64.0%, a difference of 0.0%), Arab (64.1%, a difference of 0.010%), Zimbabwean (64.1%, a difference of 0.020%), Immigrants from Western Asia (64.1%, a difference of 0.030%), and Paiute (64.0%, a difference of 0.030%).
| Demographics | Rating | Rank | Family Households |
| Spanish Americans | 30.1 /100 | #186 | Fair 64.1% |
| Northern Europeans | 28.2 /100 | #187 | Fair 64.1% |
| Paraguayans | 26.7 /100 | #188 | Fair 64.1% |
| Immigrants | Western Asia | 25.3 /100 | #189 | Fair 64.1% |
| Zimbabweans | 24.7 /100 | #190 | Fair 64.1% |
| Arabs | 24.5 /100 | #191 | Fair 64.1% |
| Lithuanians | 23.8 /100 | #192 | Fair 64.0% |
| French | 23.7 /100 | #193 | Fair 64.0% |
| Paiute | 22.2 /100 | #194 | Fair 64.0% |
| Immigrants | North America | 20.0 /100 | #195 | Poor 64.0% |
| Immigrants | Canada | 19.2 /100 | #196 | Poor 64.0% |
| Seminole | 18.9 /100 | #197 | Poor 64.0% |
| Poles | 18.9 /100 | #198 | Poor 64.0% |
| Slavs | 18.6 /100 | #199 | Poor 64.0% |
| Immigrants | Malaysia | 17.9 /100 | #200 | Poor 64.0% |
Demographics Similar to U.S. Virgin Islanders by Family Households
In terms of family households, the demographic groups most similar to U.S. Virgin Islanders are Immigrants from Grenada (62.6%, a difference of 0.050%), Immigrants from Burma/Myanmar (62.6%, a difference of 0.050%), Immigrants from Nepal (62.7%, a difference of 0.13%), Immigrants from Sweden (62.5%, a difference of 0.18%), and Immigrants from Uganda (62.7%, a difference of 0.22%).
| Demographics | Rating | Rank | Family Households |
| Australians | 0.1 /100 | #284 | Tragic 62.8% |
| Mongolians | 0.1 /100 | #285 | Tragic 62.8% |
| British West Indians | 0.1 /100 | #286 | Tragic 62.8% |
| Latvians | 0.1 /100 | #287 | Tragic 62.8% |
| Immigrants | Uganda | 0.1 /100 | #288 | Tragic 62.7% |
| Immigrants | Nepal | 0.1 /100 | #289 | Tragic 62.7% |
| Immigrants | Grenada | 0.0 /100 | #290 | Tragic 62.6% |
| U.S. Virgin Islanders | 0.0 /100 | #291 | Tragic 62.6% |
| Immigrants | Burma/Myanmar | 0.0 /100 | #292 | Tragic 62.6% |
| Immigrants | Sweden | 0.0 /100 | #293 | Tragic 62.5% |
| Barbadians | 0.0 /100 | #294 | Tragic 62.5% |
| Okinawans | 0.0 /100 | #295 | Tragic 62.5% |
| Slovenes | 0.0 /100 | #296 | Tragic 62.4% |
| French American Indians | 0.0 /100 | #297 | Tragic 62.4% |
| Immigrants | Spain | 0.0 /100 | #298 | Tragic 62.4% |