Fijian vs U.S. Virgin Islander Family Households
COMPARE
Fijian
U.S. Virgin Islander
Family Households
Family Households Comparison
Fijians
U.S. Virgin Islanders
65.9%
FAMILY HOUSEHOLDS
99.9/ 100
METRIC RATING
66th/ 347
METRIC RANK
62.6%
FAMILY HOUSEHOLDS
0.0/ 100
METRIC RATING
291st/ 347
METRIC RANK
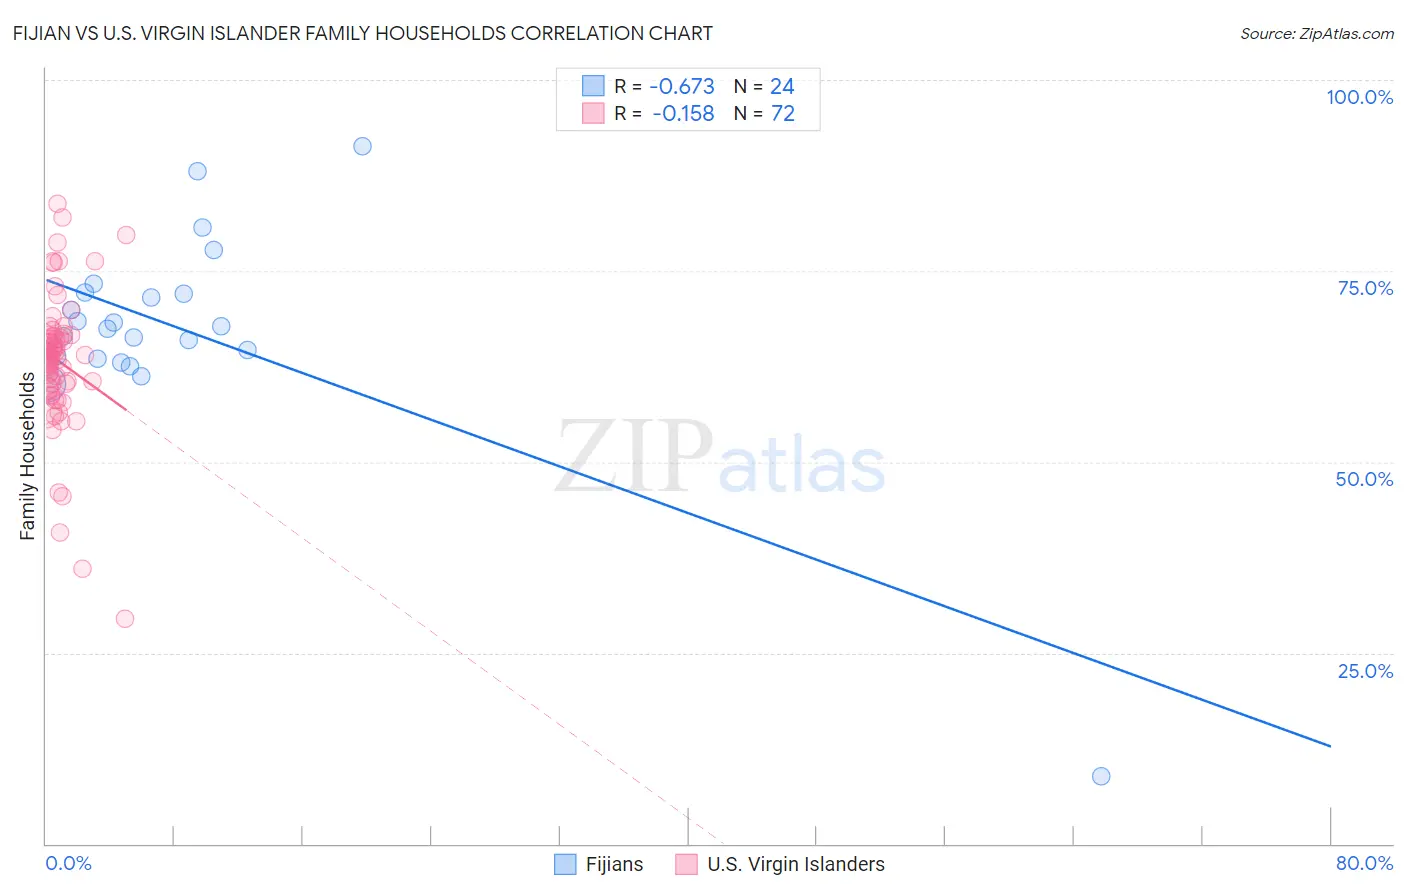
Fijian vs U.S. Virgin Islander Family Households Correlation Chart
The statistical analysis conducted on geographies consisting of 55,947,966 people shows a significant negative correlation between the proportion of Fijians and percentage of family households in the United States with a correlation coefficient (R) of -0.673 and weighted average of 65.9%. Similarly, the statistical analysis conducted on geographies consisting of 87,507,759 people shows a poor negative correlation between the proportion of U.S. Virgin Islanders and percentage of family households in the United States with a correlation coefficient (R) of -0.158 and weighted average of 62.6%, a difference of 5.3%.
Family Households Correlation Summary
| Measurement | Fijian | U.S. Virgin Islander |
| Minimum | 8.8% | 29.5% |
| Maximum | 91.4% | 83.8% |
| Range | 82.6% | 54.3% |
| Mean | 67.3% | 63.2% |
| Median | 67.6% | 63.9% |
| Interquartile 25% (IQ1) | 63.7% | 59.9% |
| Interquartile 75% (IQ3) | 72.0% | 66.5% |
| Interquartile Range (IQR) | 8.4% | 6.6% |
| Standard Deviation (Sample) | 14.7% | 9.1% |
| Standard Deviation (Population) | 14.4% | 9.1% |
Similar Demographics by Family Households
Demographics Similar to Fijians by Family Households
In terms of family households, the demographic groups most similar to Fijians are Filipino (65.9%, a difference of 0.0%), Japanese (65.9%, a difference of 0.020%), Costa Rican (65.9%, a difference of 0.040%), Pima (65.9%, a difference of 0.050%), and Malaysian (65.9%, a difference of 0.050%).
| Demographics | Rating | Rank | Family Households |
| Immigrants | Korea | 100.0 /100 | #59 | Exceptional 66.0% |
| South Americans | 100.0 /100 | #60 | Exceptional 66.0% |
| Danes | 100.0 /100 | #61 | Exceptional 66.0% |
| Central Americans | 100.0 /100 | #62 | Exceptional 66.0% |
| Immigrants | Indonesia | 100.0 /100 | #63 | Exceptional 66.0% |
| Pima | 99.9 /100 | #64 | Exceptional 65.9% |
| Costa Ricans | 99.9 /100 | #65 | Exceptional 65.9% |
| Fijians | 99.9 /100 | #66 | Exceptional 65.9% |
| Filipinos | 99.9 /100 | #67 | Exceptional 65.9% |
| Japanese | 99.9 /100 | #68 | Exceptional 65.9% |
| Malaysians | 99.9 /100 | #69 | Exceptional 65.9% |
| Immigrants | Afghanistan | 99.9 /100 | #70 | Exceptional 65.9% |
| Bhutanese | 99.9 /100 | #71 | Exceptional 65.9% |
| Portuguese | 99.9 /100 | #72 | Exceptional 65.8% |
| Laotians | 99.9 /100 | #73 | Exceptional 65.8% |
Demographics Similar to U.S. Virgin Islanders by Family Households
In terms of family households, the demographic groups most similar to U.S. Virgin Islanders are Immigrants from Grenada (62.6%, a difference of 0.050%), Immigrants from Burma/Myanmar (62.6%, a difference of 0.050%), Immigrants from Nepal (62.7%, a difference of 0.13%), Immigrants from Sweden (62.5%, a difference of 0.18%), and Immigrants from Uganda (62.7%, a difference of 0.22%).
| Demographics | Rating | Rank | Family Households |
| Australians | 0.1 /100 | #284 | Tragic 62.8% |
| Mongolians | 0.1 /100 | #285 | Tragic 62.8% |
| British West Indians | 0.1 /100 | #286 | Tragic 62.8% |
| Latvians | 0.1 /100 | #287 | Tragic 62.8% |
| Immigrants | Uganda | 0.1 /100 | #288 | Tragic 62.7% |
| Immigrants | Nepal | 0.1 /100 | #289 | Tragic 62.7% |
| Immigrants | Grenada | 0.0 /100 | #290 | Tragic 62.6% |
| U.S. Virgin Islanders | 0.0 /100 | #291 | Tragic 62.6% |
| Immigrants | Burma/Myanmar | 0.0 /100 | #292 | Tragic 62.6% |
| Immigrants | Sweden | 0.0 /100 | #293 | Tragic 62.5% |
| Barbadians | 0.0 /100 | #294 | Tragic 62.5% |
| Okinawans | 0.0 /100 | #295 | Tragic 62.5% |
| Slovenes | 0.0 /100 | #296 | Tragic 62.4% |
| French American Indians | 0.0 /100 | #297 | Tragic 62.4% |
| Immigrants | Spain | 0.0 /100 | #298 | Tragic 62.4% |