Immigrants from Belarus vs Immigrants from Albania Family Households
COMPARE
Immigrants from Belarus
Immigrants from Albania
Family Households
Family Households Comparison
Immigrants from Belarus
Immigrants from Albania
63.7%
FAMILY HOUSEHOLDS
5.5/ 100
METRIC RATING
222nd/ 347
METRIC RANK
62.4%
FAMILY HOUSEHOLDS
0.0/ 100
METRIC RATING
301st/ 347
METRIC RANK
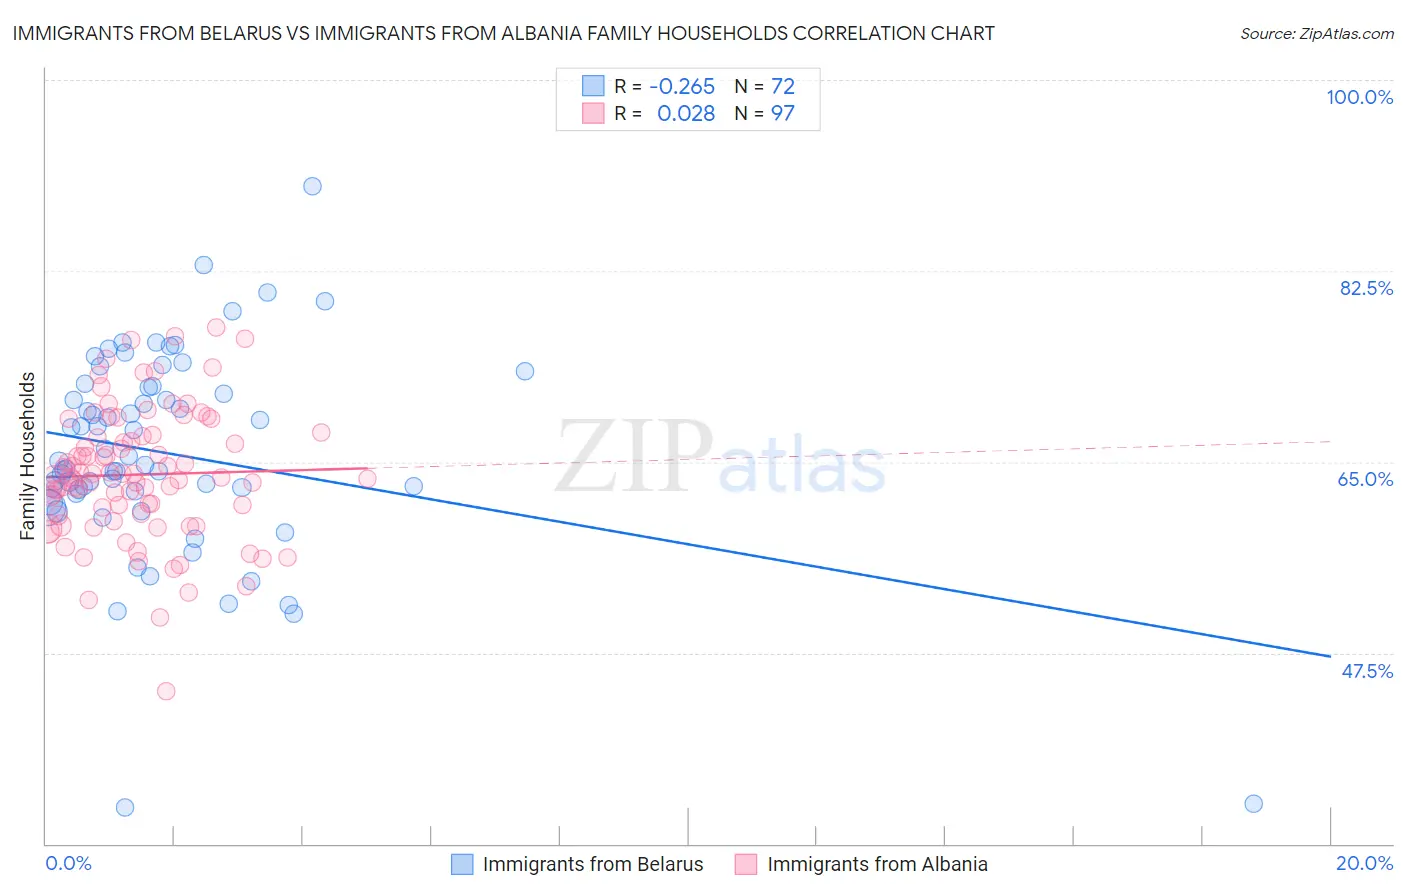
Immigrants from Belarus vs Immigrants from Albania Family Households Correlation Chart
The statistical analysis conducted on geographies consisting of 150,177,512 people shows a weak negative correlation between the proportion of Immigrants from Belarus and percentage of family households in the United States with a correlation coefficient (R) of -0.265 and weighted average of 63.7%. Similarly, the statistical analysis conducted on geographies consisting of 119,383,299 people shows no correlation between the proportion of Immigrants from Albania and percentage of family households in the United States with a correlation coefficient (R) of 0.028 and weighted average of 62.4%, a difference of 2.1%.
Family Households Correlation Summary
| Measurement | Immigrants from Belarus | Immigrants from Albania |
| Minimum | 33.4% | 44.0% |
| Maximum | 90.2% | 77.4% |
| Range | 56.9% | 33.4% |
| Mean | 65.8% | 63.8% |
| Median | 64.9% | 63.6% |
| Interquartile 25% (IQ1) | 62.2% | 60.2% |
| Interquartile 75% (IQ3) | 71.9% | 67.4% |
| Interquartile Range (IQR) | 9.7% | 7.2% |
| Standard Deviation (Sample) | 9.5% | 6.0% |
| Standard Deviation (Population) | 9.4% | 6.0% |
Similar Demographics by Family Households
Demographics Similar to Immigrants from Belarus by Family Households
In terms of family households, the demographic groups most similar to Immigrants from Belarus are French Canadian (63.7%, a difference of 0.010%), Immigrants from South Africa (63.7%, a difference of 0.030%), Immigrants from Europe (63.7%, a difference of 0.050%), Macedonian (63.7%, a difference of 0.060%), and Turkish (63.6%, a difference of 0.070%).
| Demographics | Rating | Rank | Family Households |
| Belgians | 7.6 /100 | #215 | Tragic 63.8% |
| Croatians | 7.3 /100 | #216 | Tragic 63.8% |
| Osage | 7.0 /100 | #217 | Tragic 63.7% |
| Marshallese | 6.9 /100 | #218 | Tragic 63.7% |
| Macedonians | 6.5 /100 | #219 | Tragic 63.7% |
| Immigrants | Europe | 6.4 /100 | #220 | Tragic 63.7% |
| Immigrants | South Africa | 5.9 /100 | #221 | Tragic 63.7% |
| Immigrants | Belarus | 5.5 /100 | #222 | Tragic 63.7% |
| French Canadians | 5.4 /100 | #223 | Tragic 63.7% |
| Turks | 4.5 /100 | #224 | Tragic 63.6% |
| Immigrants | Hungary | 4.3 /100 | #225 | Tragic 63.6% |
| Immigrants | Bahamas | 4.2 /100 | #226 | Tragic 63.6% |
| Trinidadians and Tobagonians | 4.1 /100 | #227 | Tragic 63.6% |
| Blackfeet | 3.6 /100 | #228 | Tragic 63.6% |
| Bulgarians | 3.4 /100 | #229 | Tragic 63.6% |
Demographics Similar to Immigrants from Albania by Family Households
In terms of family households, the demographic groups most similar to Immigrants from Albania are Immigrants from Africa (62.4%, a difference of 0.020%), Immigrants from Kuwait (62.4%, a difference of 0.030%), Immigrants from Kenya (62.3%, a difference of 0.040%), Immigrants from Spain (62.4%, a difference of 0.090%), and Cree (62.3%, a difference of 0.10%).
| Demographics | Rating | Rank | Family Households |
| Barbadians | 0.0 /100 | #294 | Tragic 62.5% |
| Okinawans | 0.0 /100 | #295 | Tragic 62.5% |
| Slovenes | 0.0 /100 | #296 | Tragic 62.4% |
| French American Indians | 0.0 /100 | #297 | Tragic 62.4% |
| Immigrants | Spain | 0.0 /100 | #298 | Tragic 62.4% |
| Immigrants | Kuwait | 0.0 /100 | #299 | Tragic 62.4% |
| Immigrants | Africa | 0.0 /100 | #300 | Tragic 62.4% |
| Immigrants | Albania | 0.0 /100 | #301 | Tragic 62.4% |
| Immigrants | Kenya | 0.0 /100 | #302 | Tragic 62.3% |
| Cree | 0.0 /100 | #303 | Tragic 62.3% |
| Iroquois | 0.0 /100 | #304 | Tragic 62.2% |
| Bermudans | 0.0 /100 | #305 | Tragic 62.2% |
| Africans | 0.0 /100 | #306 | Tragic 62.1% |
| Immigrants | Norway | 0.0 /100 | #307 | Tragic 62.1% |
| Chippewa | 0.0 /100 | #308 | Tragic 62.1% |