Immigrants from Belarus vs South African Family Households
COMPARE
Immigrants from Belarus
South African
Family Households
Family Households Comparison
Immigrants from Belarus
South Africans
63.7%
FAMILY HOUSEHOLDS
5.5/ 100
METRIC RATING
222nd/ 347
METRIC RANK
63.4%
FAMILY HOUSEHOLDS
1.9/ 100
METRIC RATING
240th/ 347
METRIC RANK
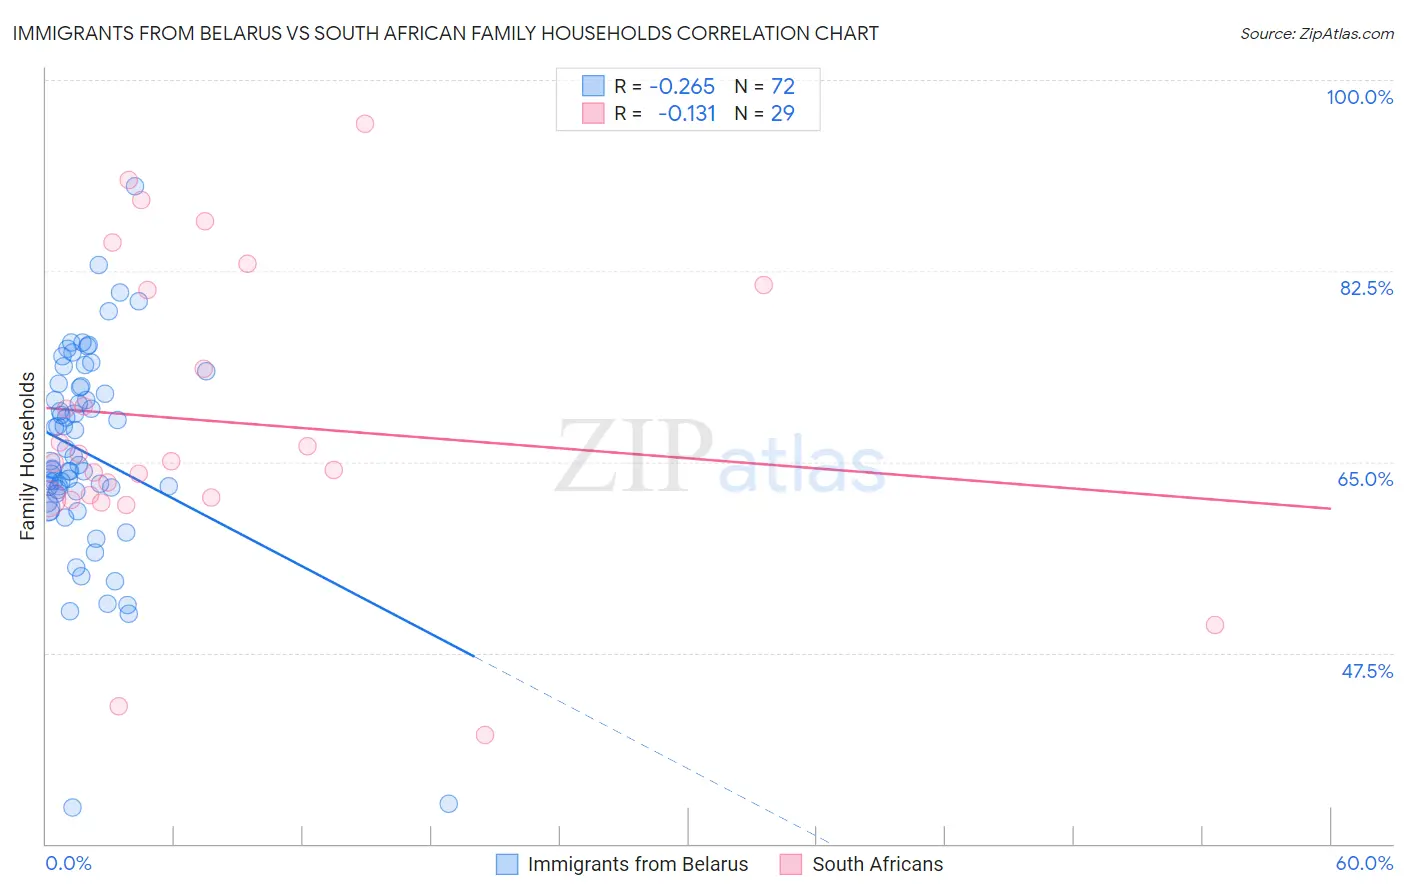
Immigrants from Belarus vs South African Family Households Correlation Chart
The statistical analysis conducted on geographies consisting of 150,177,512 people shows a weak negative correlation between the proportion of Immigrants from Belarus and percentage of family households in the United States with a correlation coefficient (R) of -0.265 and weighted average of 63.7%. Similarly, the statistical analysis conducted on geographies consisting of 182,542,946 people shows a poor negative correlation between the proportion of South Africans and percentage of family households in the United States with a correlation coefficient (R) of -0.131 and weighted average of 63.4%, a difference of 0.38%.
Family Households Correlation Summary
| Measurement | Immigrants from Belarus | South African |
| Minimum | 33.4% | 40.0% |
| Maximum | 90.2% | 96.0% |
| Range | 56.9% | 56.0% |
| Mean | 65.8% | 68.7% |
| Median | 64.9% | 65.1% |
| Interquartile 25% (IQ1) | 62.2% | 61.7% |
| Interquartile 75% (IQ3) | 71.9% | 81.0% |
| Interquartile Range (IQR) | 9.7% | 19.3% |
| Standard Deviation (Sample) | 9.5% | 13.5% |
| Standard Deviation (Population) | 9.4% | 13.2% |
Demographics Similar to Immigrants from Belarus and South Africans by Family Households
In terms of family households, the demographic groups most similar to Immigrants from Belarus are French Canadian (63.7%, a difference of 0.010%), Immigrants from South Africa (63.7%, a difference of 0.030%), Turkish (63.6%, a difference of 0.070%), Immigrants from Hungary (63.6%, a difference of 0.090%), and Immigrants from Bahamas (63.6%, a difference of 0.10%). Similarly, the demographic groups most similar to South Africans are Aleut (63.4%, a difference of 0.0%), Immigrants from St. Vincent and the Grenadines (63.4%, a difference of 0.010%), Comanche (63.5%, a difference of 0.030%), Immigrants from Zimbabwe (63.5%, a difference of 0.030%), and Ghanaian (63.5%, a difference of 0.040%).
| Demographics | Rating | Rank | Family Households |
| Immigrants | South Africa | 5.9 /100 | #221 | Tragic 63.7% |
| Immigrants | Belarus | 5.5 /100 | #222 | Tragic 63.7% |
| French Canadians | 5.4 /100 | #223 | Tragic 63.7% |
| Turks | 4.5 /100 | #224 | Tragic 63.6% |
| Immigrants | Hungary | 4.3 /100 | #225 | Tragic 63.6% |
| Immigrants | Bahamas | 4.2 /100 | #226 | Tragic 63.6% |
| Trinidadians and Tobagonians | 4.1 /100 | #227 | Tragic 63.6% |
| Blackfeet | 3.6 /100 | #228 | Tragic 63.6% |
| Bulgarians | 3.4 /100 | #229 | Tragic 63.6% |
| Immigrants | Brazil | 3.0 /100 | #230 | Tragic 63.6% |
| Immigrants | Greece | 2.9 /100 | #231 | Tragic 63.5% |
| Immigrants | Northern Africa | 2.6 /100 | #232 | Tragic 63.5% |
| Immigrants | Armenia | 2.6 /100 | #233 | Tragic 63.5% |
| Finns | 2.3 /100 | #234 | Tragic 63.5% |
| Albanians | 2.2 /100 | #235 | Tragic 63.5% |
| Ghanaians | 2.1 /100 | #236 | Tragic 63.5% |
| Comanche | 2.1 /100 | #237 | Tragic 63.5% |
| Immigrants | Zimbabwe | 2.0 /100 | #238 | Tragic 63.5% |
| Aleuts | 1.9 /100 | #239 | Tragic 63.4% |
| South Africans | 1.9 /100 | #240 | Tragic 63.4% |
| Immigrants | St. Vincent and the Grenadines | 1.9 /100 | #241 | Tragic 63.4% |