Immigrants from Barbados vs Central American Indian Married-couple Households
COMPARE
Immigrants from Barbados
Central American Indian
Married-couple Households
Married-couple Households Comparison
Immigrants from Barbados
Central American Indians
39.2%
MARRIED-COUPLE HOUSEHOLDS
0.0/ 100
METRIC RATING
330th/ 347
METRIC RANK
43.8%
MARRIED-COUPLE HOUSEHOLDS
0.2/ 100
METRIC RATING
258th/ 347
METRIC RANK
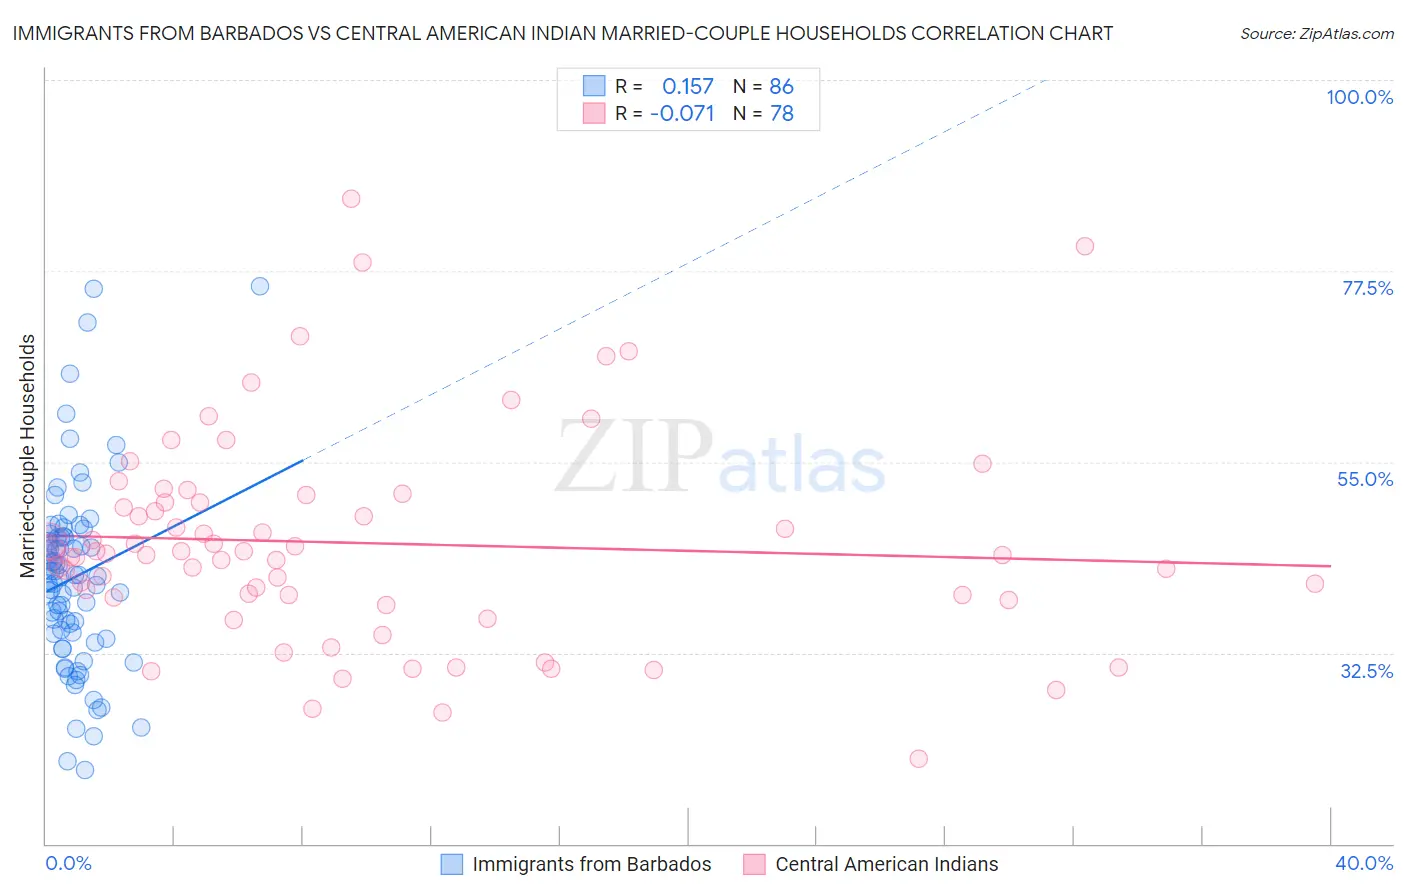
Immigrants from Barbados vs Central American Indian Married-couple Households Correlation Chart
The statistical analysis conducted on geographies consisting of 112,771,790 people shows a poor positive correlation between the proportion of Immigrants from Barbados and percentage of married-couple family households in the United States with a correlation coefficient (R) of 0.157 and weighted average of 39.2%. Similarly, the statistical analysis conducted on geographies consisting of 326,060,937 people shows a slight negative correlation between the proportion of Central American Indians and percentage of married-couple family households in the United States with a correlation coefficient (R) of -0.071 and weighted average of 43.8%, a difference of 11.6%.
Married-couple Households Correlation Summary
| Measurement | Immigrants from Barbados | Central American Indian |
| Minimum | 18.6% | 20.1% |
| Maximum | 75.7% | 86.0% |
| Range | 57.1% | 65.9% |
| Mean | 41.4% | 45.4% |
| Median | 41.6% | 44.1% |
| Interquartile 25% (IQ1) | 34.8% | 39.0% |
| Interquartile 75% (IQ3) | 46.1% | 50.2% |
| Interquartile Range (IQR) | 11.3% | 11.3% |
| Standard Deviation (Sample) | 11.0% | 12.5% |
| Standard Deviation (Population) | 10.9% | 12.4% |
Similar Demographics by Married-couple Households
Demographics Similar to Immigrants from Barbados by Married-couple Households
In terms of married-couple households, the demographic groups most similar to Immigrants from Barbados are Immigrants from Dominica (39.4%, a difference of 0.44%), Immigrants from Congo (39.0%, a difference of 0.44%), Barbadian (39.4%, a difference of 0.52%), Somali (39.0%, a difference of 0.52%), and Immigrants from West Indies (39.0%, a difference of 0.56%).
| Demographics | Rating | Rank | Married-couple Households |
| Puerto Ricans | 0.0 /100 | #323 | Tragic 40.1% |
| Navajo | 0.0 /100 | #324 | Tragic 40.1% |
| Pueblo | 0.0 /100 | #325 | Tragic 40.0% |
| U.S. Virgin Islanders | 0.0 /100 | #326 | Tragic 39.8% |
| Lumbee | 0.0 /100 | #327 | Tragic 39.6% |
| Barbadians | 0.0 /100 | #328 | Tragic 39.4% |
| Immigrants | Dominica | 0.0 /100 | #329 | Tragic 39.4% |
| Immigrants | Barbados | 0.0 /100 | #330 | Tragic 39.2% |
| Immigrants | Congo | 0.0 /100 | #331 | Tragic 39.0% |
| Somalis | 0.0 /100 | #332 | Tragic 39.0% |
| Immigrants | West Indies | 0.0 /100 | #333 | Tragic 39.0% |
| Immigrants | St. Vincent and the Grenadines | 0.0 /100 | #334 | Tragic 38.7% |
| Senegalese | 0.0 /100 | #335 | Tragic 38.6% |
| Blacks/African Americans | 0.0 /100 | #336 | Tragic 38.5% |
| Immigrants | Somalia | 0.0 /100 | #337 | Tragic 38.4% |
Demographics Similar to Central American Indians by Married-couple Households
In terms of married-couple households, the demographic groups most similar to Central American Indians are Iroquois (43.7%, a difference of 0.030%), Blackfeet (43.8%, a difference of 0.040%), Immigrants from Cameroon (43.7%, a difference of 0.12%), Ugandan (43.8%, a difference of 0.20%), and Alaskan Athabascan (43.6%, a difference of 0.25%).
| Demographics | Rating | Rank | Married-couple Households |
| German Russians | 0.4 /100 | #251 | Tragic 44.0% |
| Seminole | 0.4 /100 | #252 | Tragic 44.0% |
| Central Americans | 0.3 /100 | #253 | Tragic 43.9% |
| Apache | 0.3 /100 | #254 | Tragic 43.9% |
| Shoshone | 0.3 /100 | #255 | Tragic 43.9% |
| Ugandans | 0.3 /100 | #256 | Tragic 43.8% |
| Blackfeet | 0.2 /100 | #257 | Tragic 43.8% |
| Central American Indians | 0.2 /100 | #258 | Tragic 43.8% |
| Iroquois | 0.2 /100 | #259 | Tragic 43.7% |
| Immigrants | Cameroon | 0.2 /100 | #260 | Tragic 43.7% |
| Alaskan Athabascans | 0.2 /100 | #261 | Tragic 43.6% |
| Vietnamese | 0.2 /100 | #262 | Tragic 43.6% |
| Cree | 0.1 /100 | #263 | Tragic 43.6% |
| Bangladeshis | 0.1 /100 | #264 | Tragic 43.5% |
| Moroccans | 0.1 /100 | #265 | Tragic 43.5% |