Immigrants from Bahamas vs South American Indian Married-couple Households
COMPARE
Immigrants from Bahamas
South American Indian
Married-couple Households
Married-couple Households Comparison
Immigrants from Bahamas
South American Indians
41.7%
MARRIED-COUPLE HOUSEHOLDS
0.0/ 100
METRIC RATING
301st/ 347
METRIC RANK
46.0%
MARRIED-COUPLE HOUSEHOLDS
28.4/ 100
METRIC RATING
188th/ 347
METRIC RANK
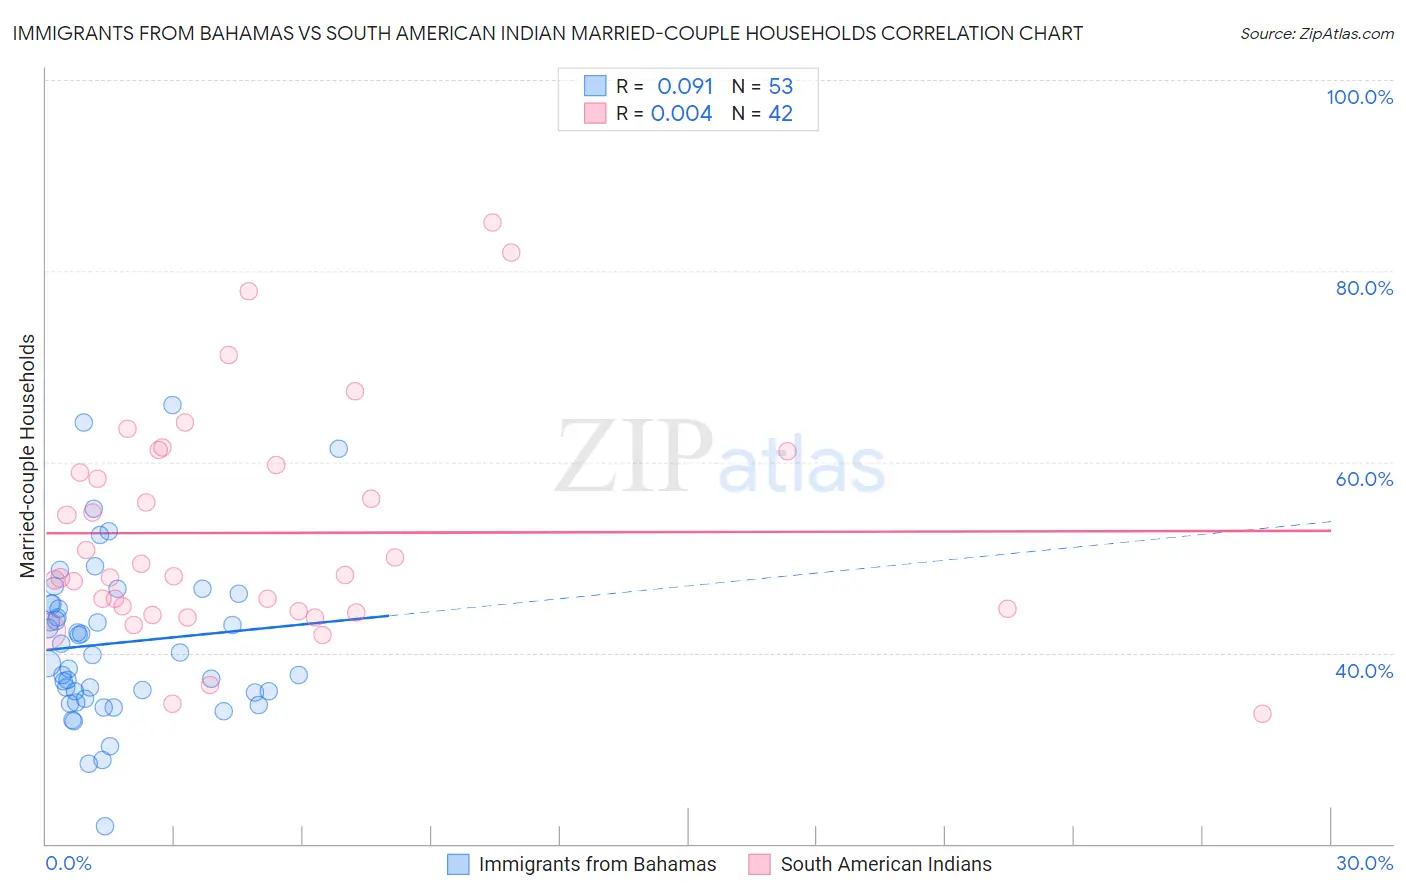
Immigrants from Bahamas vs South American Indian Married-couple Households Correlation Chart
The statistical analysis conducted on geographies consisting of 104,610,461 people shows a slight positive correlation between the proportion of Immigrants from Bahamas and percentage of married-couple family households in the United States with a correlation coefficient (R) of 0.091 and weighted average of 41.7%. Similarly, the statistical analysis conducted on geographies consisting of 164,540,449 people shows no correlation between the proportion of South American Indians and percentage of married-couple family households in the United States with a correlation coefficient (R) of 0.004 and weighted average of 46.0%, a difference of 10.5%.
Married-couple Households Correlation Summary
| Measurement | Immigrants from Bahamas | South American Indian |
| Minimum | 21.9% | 33.6% |
| Maximum | 65.9% | 85.1% |
| Range | 44.1% | 51.5% |
| Mean | 41.0% | 52.6% |
| Median | 39.8% | 48.0% |
| Interquartile 25% (IQ1) | 35.6% | 44.3% |
| Interquartile 75% (IQ3) | 45.1% | 59.6% |
| Interquartile Range (IQR) | 9.6% | 15.3% |
| Standard Deviation (Sample) | 8.6% | 11.9% |
| Standard Deviation (Population) | 8.5% | 11.7% |
Similar Demographics by Married-couple Households
Demographics Similar to Immigrants from Bahamas by Married-couple Households
In terms of married-couple households, the demographic groups most similar to Immigrants from Bahamas are Immigrants from Honduras (41.6%, a difference of 0.17%), Subsaharan African (41.6%, a difference of 0.18%), Immigrants from Belize (41.8%, a difference of 0.21%), Immigrants from Ghana (41.8%, a difference of 0.23%), and Immigrants from Guyana (41.6%, a difference of 0.29%).
| Demographics | Rating | Rank | Married-couple Households |
| Immigrants | Yemen | 0.0 /100 | #294 | Tragic 42.0% |
| Kiowa | 0.0 /100 | #295 | Tragic 42.0% |
| Immigrants | Sudan | 0.0 /100 | #296 | Tragic 41.9% |
| Arapaho | 0.0 /100 | #297 | Tragic 41.8% |
| Immigrants | Middle Africa | 0.0 /100 | #298 | Tragic 41.8% |
| Immigrants | Ghana | 0.0 /100 | #299 | Tragic 41.8% |
| Immigrants | Belize | 0.0 /100 | #300 | Tragic 41.8% |
| Immigrants | Bahamas | 0.0 /100 | #301 | Tragic 41.7% |
| Immigrants | Honduras | 0.0 /100 | #302 | Tragic 41.6% |
| Sub-Saharan Africans | 0.0 /100 | #303 | Tragic 41.6% |
| Immigrants | Guyana | 0.0 /100 | #304 | Tragic 41.6% |
| Sioux | 0.0 /100 | #305 | Tragic 41.5% |
| Guyanese | 0.0 /100 | #306 | Tragic 41.4% |
| Immigrants | Western Africa | 0.0 /100 | #307 | Tragic 41.4% |
| Crow | 0.0 /100 | #308 | Tragic 41.4% |
Demographics Similar to South American Indians by Married-couple Households
In terms of married-couple households, the demographic groups most similar to South American Indians are Fijian (46.1%, a difference of 0.040%), Immigrants from Latvia (46.0%, a difference of 0.070%), Albanian (46.1%, a difference of 0.13%), Immigrants from Kuwait (46.0%, a difference of 0.14%), and Choctaw (46.0%, a difference of 0.17%).
| Demographics | Rating | Rank | Married-couple Households |
| Malaysians | 41.8 /100 | #181 | Average 46.3% |
| Yugoslavians | 38.9 /100 | #182 | Fair 46.2% |
| Immigrants | Brazil | 38.3 /100 | #183 | Fair 46.2% |
| Immigrants | Switzerland | 36.9 /100 | #184 | Fair 46.2% |
| Brazilians | 35.9 /100 | #185 | Fair 46.2% |
| Albanians | 31.1 /100 | #186 | Fair 46.1% |
| Fijians | 29.2 /100 | #187 | Fair 46.1% |
| South American Indians | 28.4 /100 | #188 | Fair 46.0% |
| Immigrants | Latvia | 26.9 /100 | #189 | Fair 46.0% |
| Immigrants | Kuwait | 25.6 /100 | #190 | Fair 46.0% |
| Choctaw | 24.9 /100 | #191 | Fair 46.0% |
| Immigrants | Northern Africa | 24.6 /100 | #192 | Fair 46.0% |
| Taiwanese | 23.4 /100 | #193 | Fair 45.9% |
| Mexican American Indians | 23.3 /100 | #194 | Fair 45.9% |
| Chickasaw | 22.7 /100 | #195 | Fair 45.9% |