Immigrants from Argentina vs South African Births to Unmarried Women
COMPARE
Immigrants from Argentina
South African
Births to Unmarried Women
Births to Unmarried Women Comparison
Immigrants from Argentina
South Africans
30.1%
BIRTHS TO UNMARRIED WOMEN
88.7/ 100
METRIC RATING
122nd/ 347
METRIC RANK
30.5%
BIRTHS TO UNMARRIED WOMEN
82.7/ 100
METRIC RATING
142nd/ 347
METRIC RANK
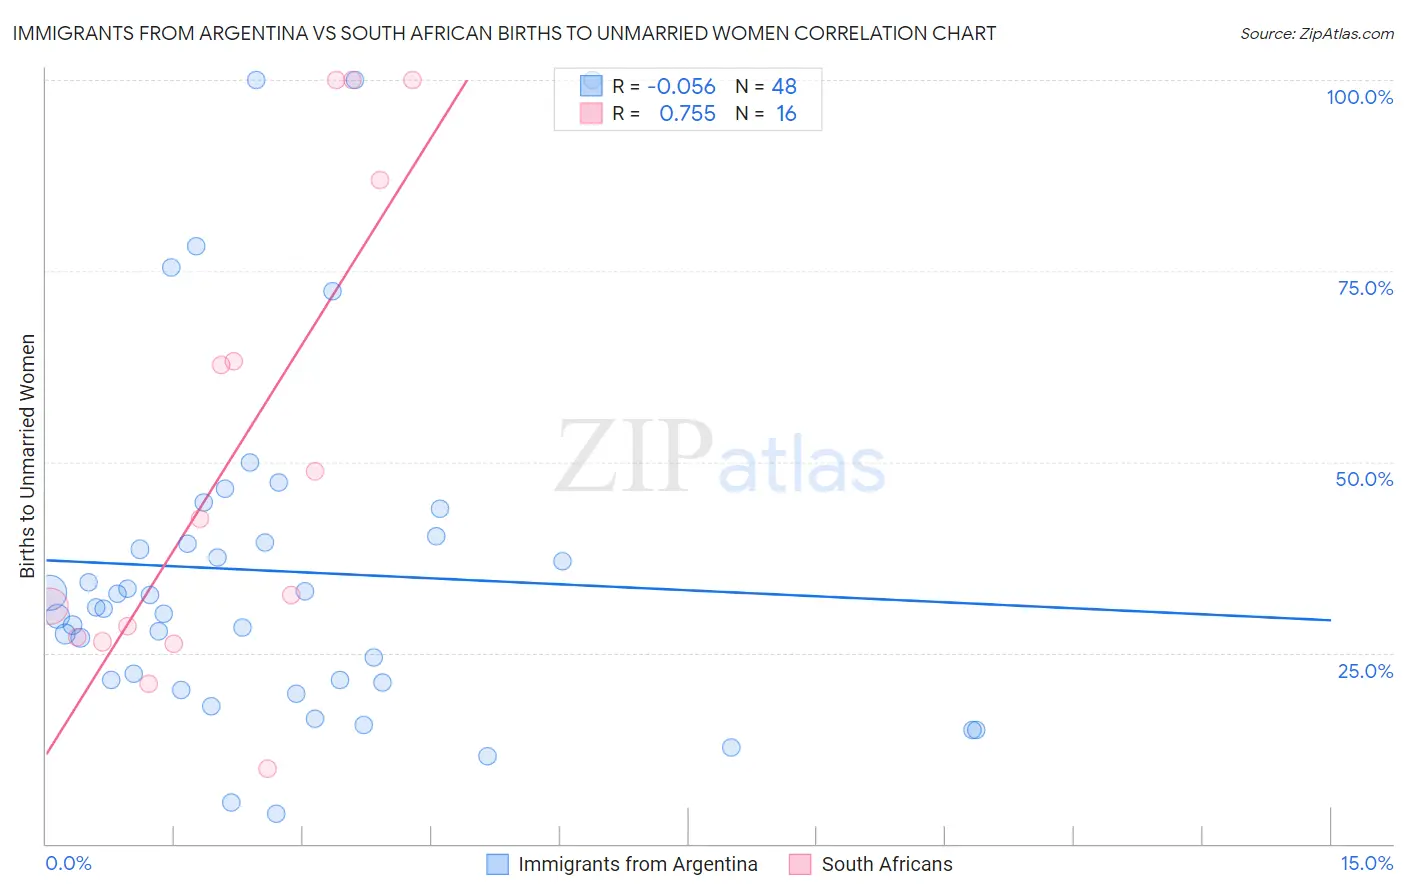
Immigrants from Argentina vs South African Births to Unmarried Women Correlation Chart
The statistical analysis conducted on geographies consisting of 249,724,782 people shows a slight negative correlation between the proportion of Immigrants from Argentina and percentage of births to unmarried women in the United States with a correlation coefficient (R) of -0.056 and weighted average of 30.1%. Similarly, the statistical analysis conducted on geographies consisting of 173,176,697 people shows a strong positive correlation between the proportion of South Africans and percentage of births to unmarried women in the United States with a correlation coefficient (R) of 0.755 and weighted average of 30.5%, a difference of 1.2%.
Births to Unmarried Women Correlation Summary
| Measurement | Immigrants from Argentina | South African |
| Minimum | 4.0% | 9.7% |
| Maximum | 100.0% | 100.0% |
| Range | 96.0% | 90.3% |
| Mean | 35.7% | 50.4% |
| Median | 30.9% | 37.5% |
| Interquartile 25% (IQ1) | 21.2% | 26.7% |
| Interquartile 75% (IQ3) | 39.8% | 75.0% |
| Interquartile Range (IQR) | 18.5% | 48.3% |
| Standard Deviation (Sample) | 22.9% | 31.1% |
| Standard Deviation (Population) | 22.7% | 30.1% |
Demographics Similar to Immigrants from Argentina and South Africans by Births to Unmarried Women
In terms of births to unmarried women, the demographic groups most similar to Immigrants from Argentina are Syrian (30.2%, a difference of 0.13%), Croatian (30.2%, a difference of 0.17%), Vietnamese (30.2%, a difference of 0.24%), European (30.2%, a difference of 0.35%), and Chinese (30.2%, a difference of 0.38%). Similarly, the demographic groups most similar to South Africans are Pakistani (30.5%, a difference of 0.060%), Swiss (30.5%, a difference of 0.080%), Immigrants from Canada (30.4%, a difference of 0.19%), Immigrants from Philippines (30.4%, a difference of 0.22%), and Puget Sound Salish (30.4%, a difference of 0.22%).
| Demographics | Rating | Rank | Births to Unmarried Women |
| Immigrants | Argentina | 88.7 /100 | #122 | Excellent 30.1% |
| Syrians | 88.2 /100 | #123 | Excellent 30.2% |
| Croatians | 88.0 /100 | #124 | Excellent 30.2% |
| Vietnamese | 87.7 /100 | #125 | Excellent 30.2% |
| Europeans | 87.2 /100 | #126 | Excellent 30.2% |
| Chinese | 87.1 /100 | #127 | Excellent 30.2% |
| Icelanders | 86.0 /100 | #128 | Excellent 30.3% |
| Immigrants | Spain | 85.8 /100 | #129 | Excellent 30.3% |
| Immigrants | Bosnia and Herzegovina | 85.7 /100 | #130 | Excellent 30.3% |
| Immigrants | Zimbabwe | 85.7 /100 | #131 | Excellent 30.3% |
| New Zealanders | 85.5 /100 | #132 | Excellent 30.3% |
| Immigrants | Morocco | 85.2 /100 | #133 | Excellent 30.4% |
| Immigrants | South Eastern Asia | 85.2 /100 | #134 | Excellent 30.4% |
| Brazilians | 84.8 /100 | #135 | Excellent 30.4% |
| Immigrants | Scotland | 84.6 /100 | #136 | Excellent 30.4% |
| Immigrants | Philippines | 83.9 /100 | #137 | Excellent 30.4% |
| Puget Sound Salish | 83.9 /100 | #138 | Excellent 30.4% |
| Immigrants | Canada | 83.7 /100 | #139 | Excellent 30.4% |
| Swiss | 83.1 /100 | #140 | Excellent 30.5% |
| Pakistanis | 83.0 /100 | #141 | Excellent 30.5% |
| South Africans | 82.7 /100 | #142 | Excellent 30.5% |