Immigrants from Argentina vs Immigrants from Armenia College, Under 1 year
COMPARE
Immigrants from Argentina
Immigrants from Armenia
College, Under 1 year
College, Under 1 year Comparison
Immigrants from Argentina
Immigrants from Armenia
67.9%
COLLEGE, UNDER 1 YEAR
97.0/ 100
METRIC RATING
100th/ 347
METRIC RANK
64.7%
COLLEGE, UNDER 1 YEAR
28.1/ 100
METRIC RATING
191st/ 347
METRIC RANK
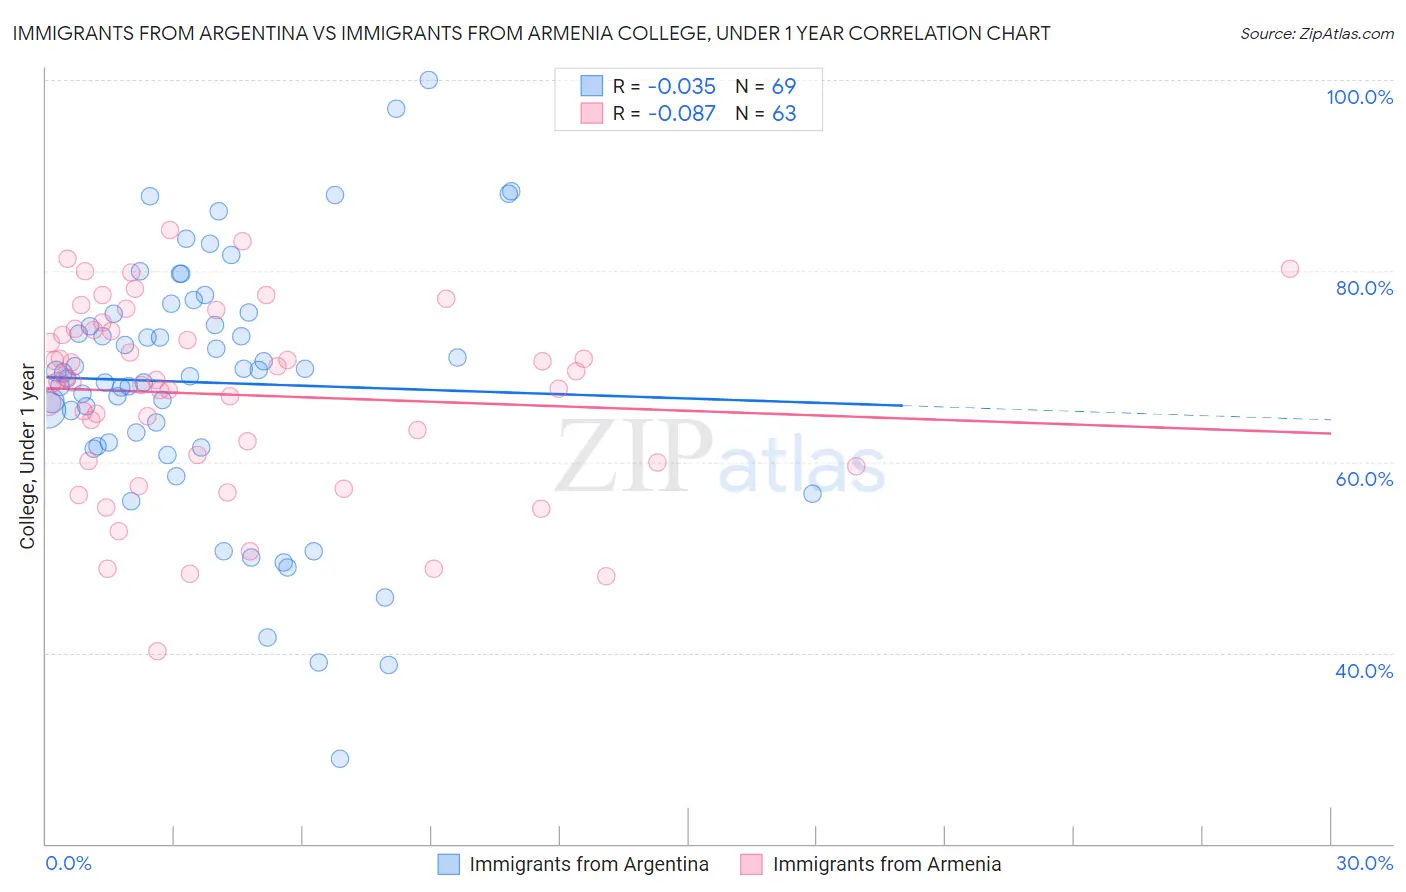
Immigrants from Argentina vs Immigrants from Armenia College, Under 1 year Correlation Chart
The statistical analysis conducted on geographies consisting of 264,437,906 people shows no correlation between the proportion of Immigrants from Argentina and percentage of population with at least college, under 1 year education in the United States with a correlation coefficient (R) of -0.035 and weighted average of 67.9%. Similarly, the statistical analysis conducted on geographies consisting of 97,725,183 people shows a slight negative correlation between the proportion of Immigrants from Armenia and percentage of population with at least college, under 1 year education in the United States with a correlation coefficient (R) of -0.087 and weighted average of 64.7%, a difference of 4.9%.
College, Under 1 year Correlation Summary
| Measurement | Immigrants from Argentina | Immigrants from Armenia |
| Minimum | 29.0% | 40.2% |
| Maximum | 100.0% | 84.3% |
| Range | 71.0% | 44.1% |
| Mean | 68.3% | 67.0% |
| Median | 69.3% | 68.4% |
| Interquartile 25% (IQ1) | 61.9% | 60.1% |
| Interquartile 75% (IQ3) | 75.6% | 73.8% |
| Interquartile Range (IQR) | 13.7% | 13.6% |
| Standard Deviation (Sample) | 13.4% | 9.7% |
| Standard Deviation (Population) | 13.3% | 9.7% |
Similar Demographics by College, Under 1 year
Demographics Similar to Immigrants from Argentina by College, Under 1 year
In terms of college, under 1 year, the demographic groups most similar to Immigrants from Argentina are Immigrants from Bolivia (67.9%, a difference of 0.010%), Paraguayan (67.9%, a difference of 0.030%), Immigrants from Eastern Europe (67.9%, a difference of 0.050%), Palestinian (67.9%, a difference of 0.050%), and Carpatho Rusyn (67.9%, a difference of 0.060%).
| Demographics | Rating | Rank | College, Under 1 year |
| Romanians | 97.9 /100 | #93 | Exceptional 68.2% |
| Armenians | 97.7 /100 | #94 | Exceptional 68.1% |
| Immigrants | Pakistan | 97.5 /100 | #95 | Exceptional 68.0% |
| Jordanians | 97.4 /100 | #96 | Exceptional 68.0% |
| Immigrants | Ethiopia | 97.3 /100 | #97 | Exceptional 68.0% |
| Paraguayans | 97.1 /100 | #98 | Exceptional 67.9% |
| Immigrants | Bolivia | 97.0 /100 | #99 | Exceptional 67.9% |
| Immigrants | Argentina | 97.0 /100 | #100 | Exceptional 67.9% |
| Immigrants | Eastern Europe | 96.9 /100 | #101 | Exceptional 67.9% |
| Palestinians | 96.9 /100 | #102 | Exceptional 67.9% |
| Carpatho Rusyns | 96.8 /100 | #103 | Exceptional 67.9% |
| Immigrants | Western Asia | 96.6 /100 | #104 | Exceptional 67.8% |
| Afghans | 96.6 /100 | #105 | Exceptional 67.8% |
| Immigrants | Croatia | 96.6 /100 | #106 | Exceptional 67.8% |
| Austrians | 96.4 /100 | #107 | Exceptional 67.8% |
Demographics Similar to Immigrants from Armenia by College, Under 1 year
In terms of college, under 1 year, the demographic groups most similar to Immigrants from Armenia are Immigrants from Thailand (64.7%, a difference of 0.060%), Slovak (64.7%, a difference of 0.070%), Immigrants from Philippines (64.8%, a difference of 0.11%), Spanish (64.9%, a difference of 0.19%), and Immigrants from Cameroon (64.6%, a difference of 0.20%).
| Demographics | Rating | Rank | College, Under 1 year |
| Bermudans | 42.0 /100 | #184 | Average 65.2% |
| Sri Lankans | 41.7 /100 | #185 | Average 65.2% |
| Immigrants | Sierra Leone | 39.7 /100 | #186 | Fair 65.1% |
| Immigrants | Southern Europe | 34.3 /100 | #187 | Fair 64.9% |
| Immigrants | Albania | 32.0 /100 | #188 | Fair 64.9% |
| Spanish | 31.6 /100 | #189 | Fair 64.9% |
| Immigrants | Philippines | 30.1 /100 | #190 | Fair 64.8% |
| Immigrants | Armenia | 28.1 /100 | #191 | Fair 64.7% |
| Immigrants | Thailand | 27.0 /100 | #192 | Fair 64.7% |
| Slovaks | 26.7 /100 | #193 | Fair 64.7% |
| Immigrants | Cameroon | 24.6 /100 | #194 | Fair 64.6% |
| Immigrants | South Eastern Asia | 22.1 /100 | #195 | Fair 64.5% |
| Tongans | 21.2 /100 | #196 | Fair 64.5% |
| Costa Ricans | 19.6 /100 | #197 | Poor 64.4% |
| Tsimshian | 17.9 /100 | #198 | Poor 64.3% |