Icelander vs Immigrants from Peru Family Households
COMPARE
Icelander
Immigrants from Peru
Family Households
Family Households Comparison
Icelanders
Immigrants from Peru
63.3%
FAMILY HOUSEHOLDS
0.8/ 100
METRIC RATING
257th/ 347
METRIC RANK
67.2%
FAMILY HOUSEHOLDS
100.0/ 100
METRIC RATING
30th/ 347
METRIC RANK
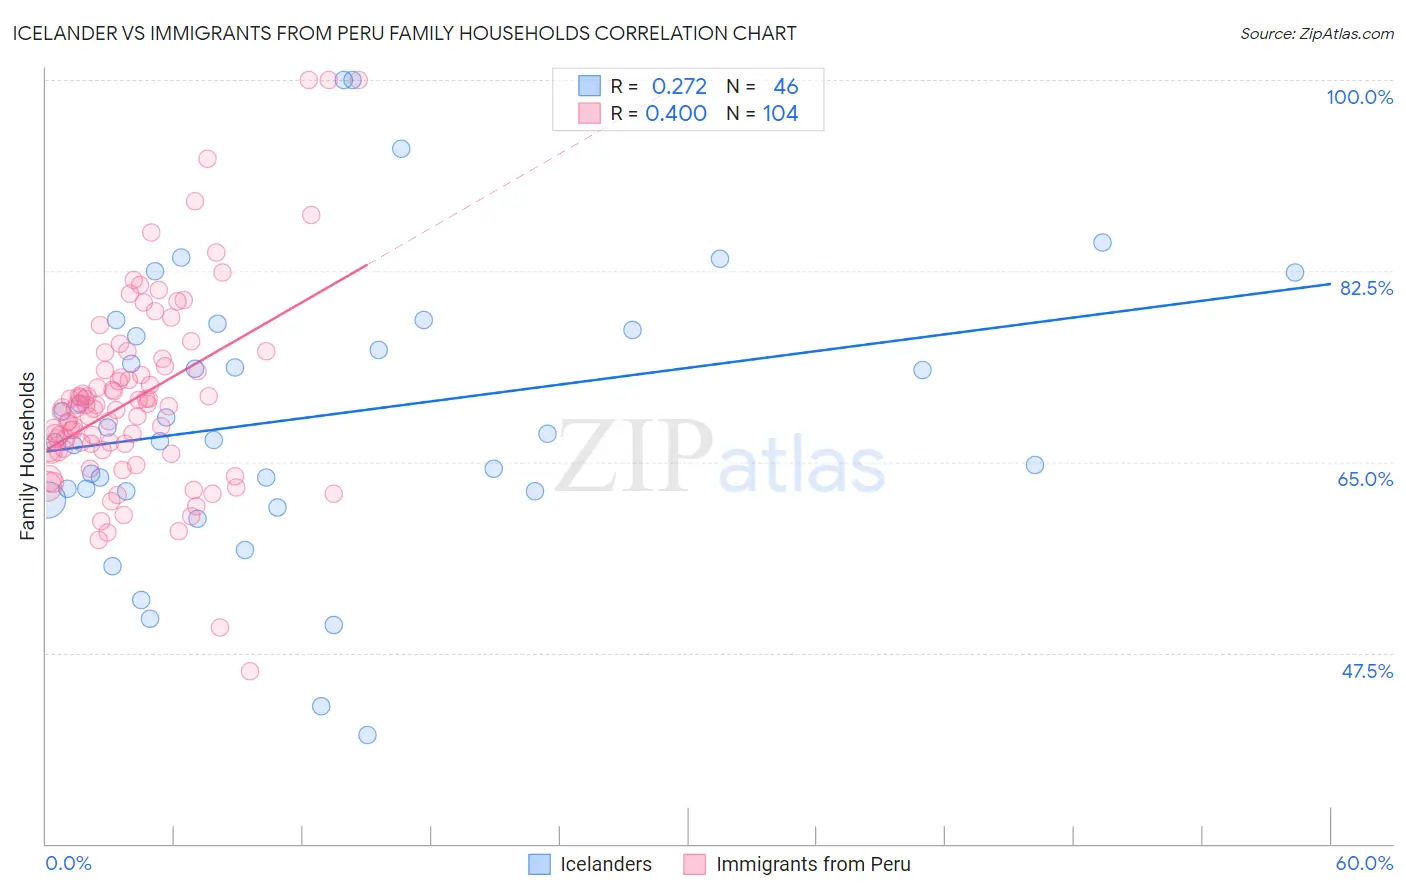
Icelander vs Immigrants from Peru Family Households Correlation Chart
The statistical analysis conducted on geographies consisting of 159,626,619 people shows a weak positive correlation between the proportion of Icelanders and percentage of family households in the United States with a correlation coefficient (R) of 0.272 and weighted average of 63.3%. Similarly, the statistical analysis conducted on geographies consisting of 328,761,314 people shows a mild positive correlation between the proportion of Immigrants from Peru and percentage of family households in the United States with a correlation coefficient (R) of 0.400 and weighted average of 67.2%, a difference of 6.3%.
Family Households Correlation Summary
| Measurement | Icelander | Immigrants from Peru |
| Minimum | 40.0% | 45.8% |
| Maximum | 100.0% | 100.0% |
| Range | 60.0% | 54.2% |
| Mean | 69.1% | 70.8% |
| Median | 67.3% | 69.9% |
| Interquartile 25% (IQ1) | 62.3% | 66.1% |
| Interquartile 75% (IQ3) | 77.1% | 73.6% |
| Interquartile Range (IQR) | 14.8% | 7.5% |
| Standard Deviation (Sample) | 12.9% | 9.0% |
| Standard Deviation (Population) | 12.7% | 8.9% |
Similar Demographics by Family Households
Demographics Similar to Icelanders by Family Households
In terms of family households, the demographic groups most similar to Icelanders are Luxembourger (63.3%, a difference of 0.040%), Potawatomi (63.3%, a difference of 0.060%), Immigrants from Barbados (63.2%, a difference of 0.070%), Immigrants from Western Europe (63.2%, a difference of 0.070%), and Immigrants from Dominican Republic (63.3%, a difference of 0.090%).
| Demographics | Rating | Rank | Family Households |
| Immigrants | Japan | 1.4 /100 | #250 | Tragic 63.4% |
| Taiwanese | 1.2 /100 | #251 | Tragic 63.3% |
| Bahamians | 1.1 /100 | #252 | Tragic 63.3% |
| Immigrants | Dominican Republic | 1.0 /100 | #253 | Tragic 63.3% |
| Slovaks | 1.0 /100 | #254 | Tragic 63.3% |
| Potawatomi | 1.0 /100 | #255 | Tragic 63.3% |
| Luxembourgers | 0.9 /100 | #256 | Tragic 63.3% |
| Icelanders | 0.8 /100 | #257 | Tragic 63.3% |
| Immigrants | Barbados | 0.7 /100 | #258 | Tragic 63.2% |
| Immigrants | Western Europe | 0.6 /100 | #259 | Tragic 63.2% |
| Cypriots | 0.6 /100 | #260 | Tragic 63.2% |
| Immigrants | Russia | 0.6 /100 | #261 | Tragic 63.2% |
| Immigrants | Ireland | 0.6 /100 | #262 | Tragic 63.2% |
| Cheyenne | 0.5 /100 | #263 | Tragic 63.2% |
| Kenyans | 0.5 /100 | #264 | Tragic 63.2% |
Demographics Similar to Immigrants from Peru by Family Households
In terms of family households, the demographic groups most similar to Immigrants from Peru are Immigrants from Latin America (67.2%, a difference of 0.010%), Nepalese (67.2%, a difference of 0.070%), Salvadoran (67.2%, a difference of 0.11%), Thai (67.2%, a difference of 0.12%), and Tohono O'odham (67.1%, a difference of 0.17%).
| Demographics | Rating | Rank | Family Households |
| Immigrants | Pakistan | 100.0 /100 | #23 | Exceptional 67.7% |
| Immigrants | South Eastern Asia | 100.0 /100 | #24 | Exceptional 67.5% |
| Immigrants | Nicaragua | 100.0 /100 | #25 | Exceptional 67.5% |
| Immigrants | India | 100.0 /100 | #26 | Exceptional 67.4% |
| Hispanics or Latinos | 100.0 /100 | #27 | Exceptional 67.4% |
| Hawaiians | 100.0 /100 | #28 | Exceptional 67.4% |
| Nicaraguans | 100.0 /100 | #29 | Exceptional 67.4% |
| Immigrants | Peru | 100.0 /100 | #30 | Exceptional 67.2% |
| Immigrants | Latin America | 100.0 /100 | #31 | Exceptional 67.2% |
| Nepalese | 100.0 /100 | #32 | Exceptional 67.2% |
| Salvadorans | 100.0 /100 | #33 | Exceptional 67.2% |
| Thais | 100.0 /100 | #34 | Exceptional 67.2% |
| Tohono O'odham | 100.0 /100 | #35 | Exceptional 67.1% |
| Peruvians | 100.0 /100 | #36 | Exceptional 67.1% |
| Tsimshian | 100.0 /100 | #37 | Exceptional 67.1% |