Indian (Asian) vs Immigrants from Peru Family Households
COMPARE
Indian (Asian)
Immigrants from Peru
Family Households
Family Households Comparison
Indians (Asian)
Immigrants from Peru
65.1%
FAMILY HOUSEHOLDS
97.9/ 100
METRIC RATING
103rd/ 347
METRIC RANK
67.2%
FAMILY HOUSEHOLDS
100.0/ 100
METRIC RATING
30th/ 347
METRIC RANK
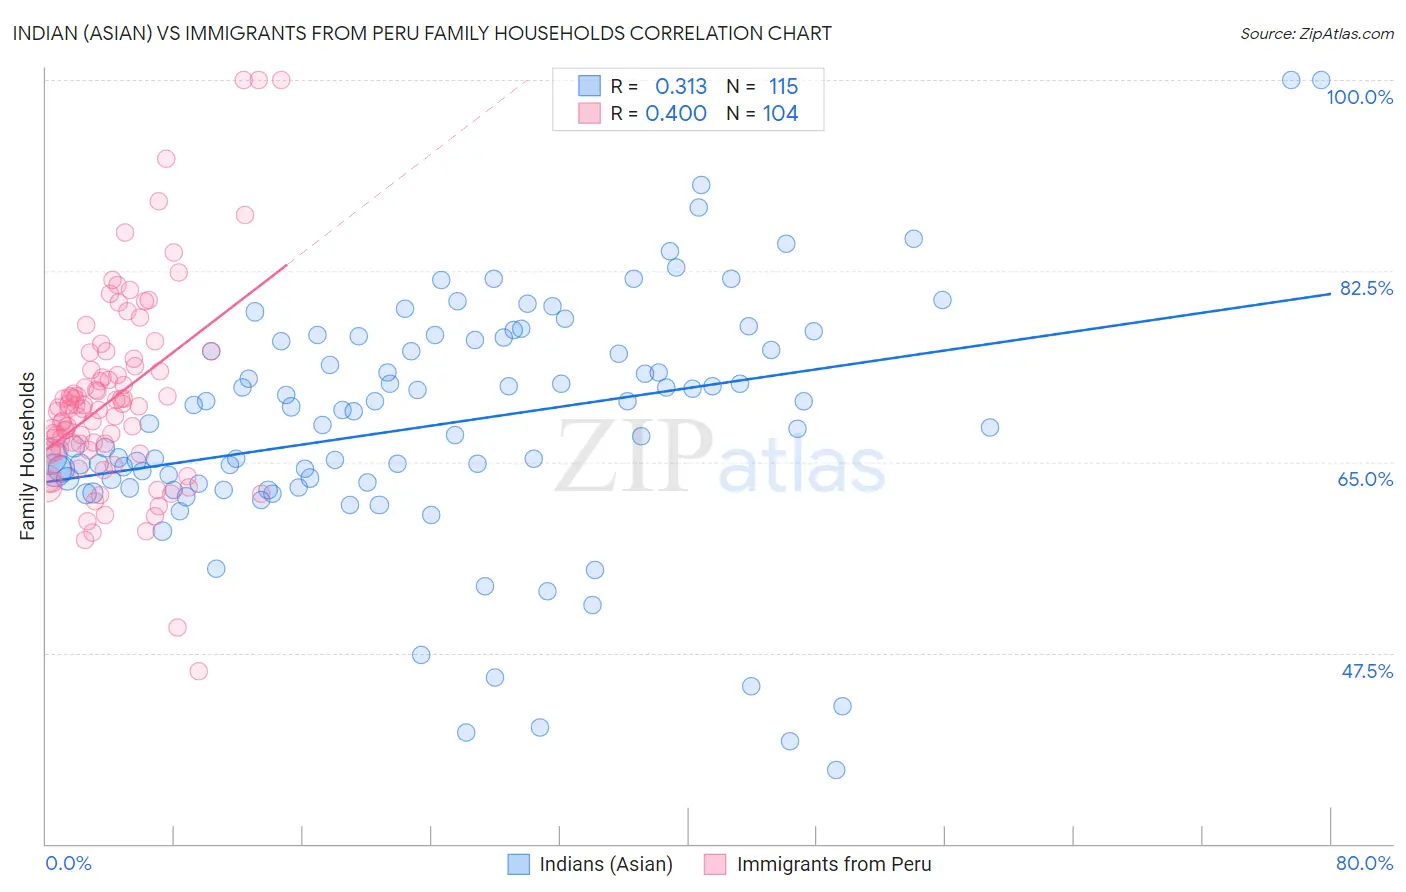
Indian (Asian) vs Immigrants from Peru Family Households Correlation Chart
The statistical analysis conducted on geographies consisting of 494,783,710 people shows a mild positive correlation between the proportion of Indians (Asian) and percentage of family households in the United States with a correlation coefficient (R) of 0.313 and weighted average of 65.1%. Similarly, the statistical analysis conducted on geographies consisting of 328,761,314 people shows a mild positive correlation between the proportion of Immigrants from Peru and percentage of family households in the United States with a correlation coefficient (R) of 0.400 and weighted average of 67.2%, a difference of 3.3%.
Family Households Correlation Summary
| Measurement | Indian (Asian) | Immigrants from Peru |
| Minimum | 36.8% | 45.8% |
| Maximum | 100.0% | 100.0% |
| Range | 63.2% | 54.2% |
| Mean | 68.4% | 70.8% |
| Median | 68.4% | 69.9% |
| Interquartile 25% (IQ1) | 63.0% | 66.1% |
| Interquartile 75% (IQ3) | 76.1% | 73.6% |
| Interquartile Range (IQR) | 13.1% | 7.5% |
| Standard Deviation (Sample) | 11.2% | 9.0% |
| Standard Deviation (Population) | 11.2% | 8.9% |
Similar Demographics by Family Households
Demographics Similar to Indians (Asian) by Family Households
In terms of family households, the demographic groups most similar to Indians (Asian) are Spaniard (65.1%, a difference of 0.010%), Immigrants from Sri Lanka (65.1%, a difference of 0.020%), Haitian (65.2%, a difference of 0.040%), Chilean (65.2%, a difference of 0.040%), and English (65.1%, a difference of 0.070%).
| Demographics | Rating | Rank | Family Households |
| Swiss | 98.6 /100 | #96 | Exceptional 65.2% |
| Guatemalans | 98.6 /100 | #97 | Exceptional 65.2% |
| Immigrants | Syria | 98.4 /100 | #98 | Exceptional 65.2% |
| Central American Indians | 98.3 /100 | #99 | Exceptional 65.2% |
| Haitians | 98.1 /100 | #100 | Exceptional 65.2% |
| Chileans | 98.1 /100 | #101 | Exceptional 65.2% |
| Immigrants | Sri Lanka | 98.0 /100 | #102 | Exceptional 65.1% |
| Indians (Asian) | 97.9 /100 | #103 | Exceptional 65.1% |
| Spaniards | 97.8 /100 | #104 | Exceptional 65.1% |
| English | 97.4 /100 | #105 | Exceptional 65.1% |
| Whites/Caucasians | 97.3 /100 | #106 | Exceptional 65.1% |
| Alaska Natives | 97.3 /100 | #107 | Exceptional 65.1% |
| Palestinians | 97.2 /100 | #108 | Exceptional 65.1% |
| Immigrants | Guatemala | 96.9 /100 | #109 | Exceptional 65.0% |
| Scandinavians | 96.8 /100 | #110 | Exceptional 65.0% |
Demographics Similar to Immigrants from Peru by Family Households
In terms of family households, the demographic groups most similar to Immigrants from Peru are Immigrants from Latin America (67.2%, a difference of 0.010%), Nepalese (67.2%, a difference of 0.070%), Salvadoran (67.2%, a difference of 0.11%), Thai (67.2%, a difference of 0.12%), and Tohono O'odham (67.1%, a difference of 0.17%).
| Demographics | Rating | Rank | Family Households |
| Immigrants | Pakistan | 100.0 /100 | #23 | Exceptional 67.7% |
| Immigrants | South Eastern Asia | 100.0 /100 | #24 | Exceptional 67.5% |
| Immigrants | Nicaragua | 100.0 /100 | #25 | Exceptional 67.5% |
| Immigrants | India | 100.0 /100 | #26 | Exceptional 67.4% |
| Hispanics or Latinos | 100.0 /100 | #27 | Exceptional 67.4% |
| Hawaiians | 100.0 /100 | #28 | Exceptional 67.4% |
| Nicaraguans | 100.0 /100 | #29 | Exceptional 67.4% |
| Immigrants | Peru | 100.0 /100 | #30 | Exceptional 67.2% |
| Immigrants | Latin America | 100.0 /100 | #31 | Exceptional 67.2% |
| Nepalese | 100.0 /100 | #32 | Exceptional 67.2% |
| Salvadorans | 100.0 /100 | #33 | Exceptional 67.2% |
| Thais | 100.0 /100 | #34 | Exceptional 67.2% |
| Tohono O'odham | 100.0 /100 | #35 | Exceptional 67.1% |
| Peruvians | 100.0 /100 | #36 | Exceptional 67.1% |
| Tsimshian | 100.0 /100 | #37 | Exceptional 67.1% |