Icelander vs Nigerian Family Households
COMPARE
Icelander
Nigerian
Family Households
Family Households Comparison
Icelanders
Nigerians
63.3%
FAMILY HOUSEHOLDS
0.8/ 100
METRIC RATING
257th/ 347
METRIC RANK
63.9%
FAMILY HOUSEHOLDS
11.5/ 100
METRIC RATING
207th/ 347
METRIC RANK
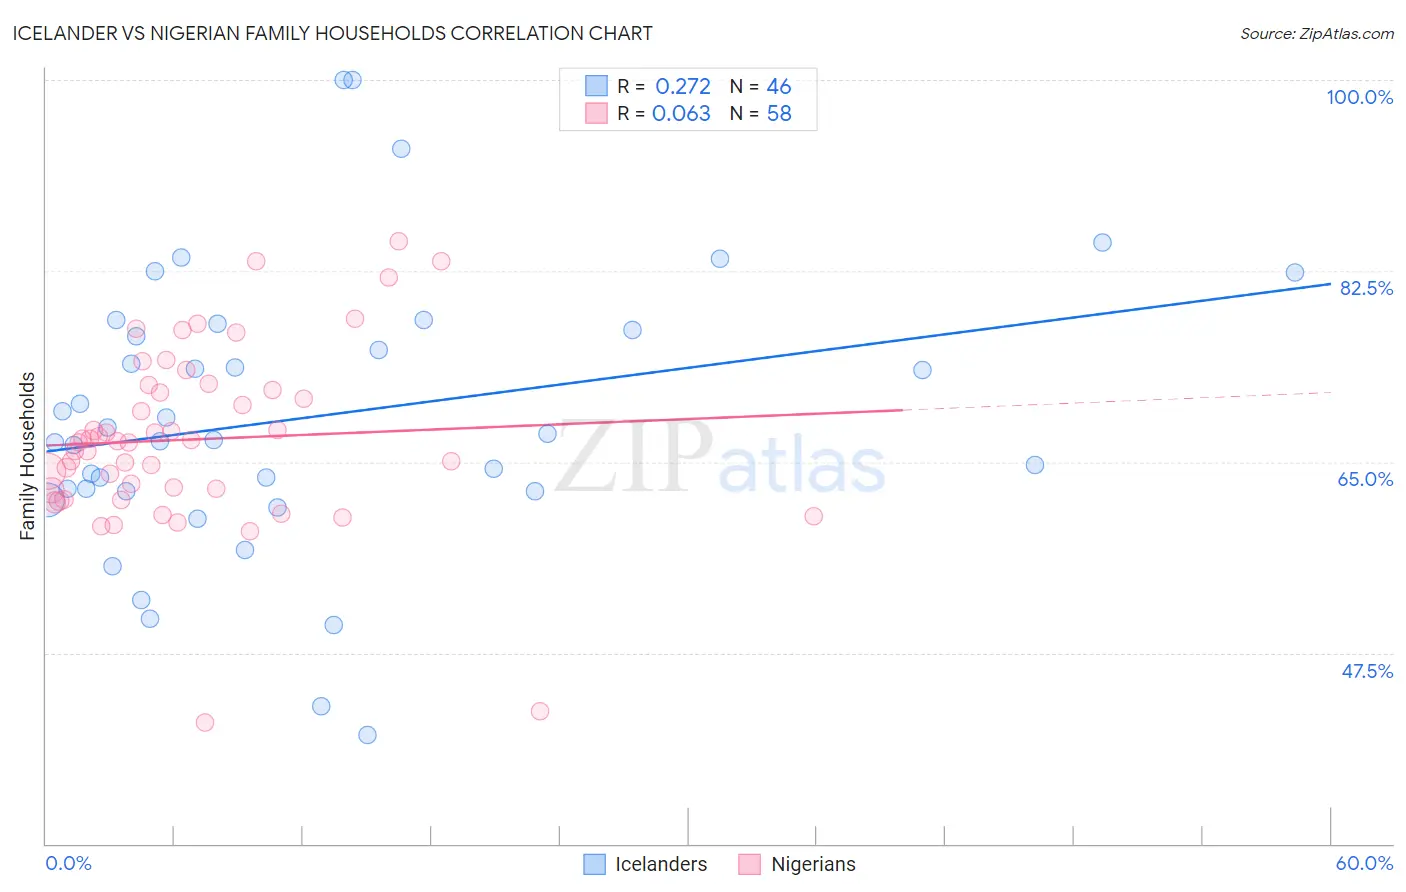
Icelander vs Nigerian Family Households Correlation Chart
The statistical analysis conducted on geographies consisting of 159,626,619 people shows a weak positive correlation between the proportion of Icelanders and percentage of family households in the United States with a correlation coefficient (R) of 0.272 and weighted average of 63.3%. Similarly, the statistical analysis conducted on geographies consisting of 332,466,874 people shows a slight positive correlation between the proportion of Nigerians and percentage of family households in the United States with a correlation coefficient (R) of 0.063 and weighted average of 63.9%, a difference of 0.95%.
Family Households Correlation Summary
| Measurement | Icelander | Nigerian |
| Minimum | 40.0% | 41.2% |
| Maximum | 100.0% | 85.2% |
| Range | 60.0% | 44.1% |
| Mean | 69.1% | 67.1% |
| Median | 67.3% | 66.9% |
| Interquartile 25% (IQ1) | 62.3% | 62.4% |
| Interquartile 75% (IQ3) | 77.1% | 71.6% |
| Interquartile Range (IQR) | 14.8% | 9.2% |
| Standard Deviation (Sample) | 12.9% | 8.2% |
| Standard Deviation (Population) | 12.7% | 8.2% |
Similar Demographics by Family Households
Demographics Similar to Icelanders by Family Households
In terms of family households, the demographic groups most similar to Icelanders are Luxembourger (63.3%, a difference of 0.040%), Potawatomi (63.3%, a difference of 0.060%), Immigrants from Barbados (63.2%, a difference of 0.070%), Immigrants from Western Europe (63.2%, a difference of 0.070%), and Immigrants from Dominican Republic (63.3%, a difference of 0.090%).
| Demographics | Rating | Rank | Family Households |
| Immigrants | Japan | 1.4 /100 | #250 | Tragic 63.4% |
| Taiwanese | 1.2 /100 | #251 | Tragic 63.3% |
| Bahamians | 1.1 /100 | #252 | Tragic 63.3% |
| Immigrants | Dominican Republic | 1.0 /100 | #253 | Tragic 63.3% |
| Slovaks | 1.0 /100 | #254 | Tragic 63.3% |
| Potawatomi | 1.0 /100 | #255 | Tragic 63.3% |
| Luxembourgers | 0.9 /100 | #256 | Tragic 63.3% |
| Icelanders | 0.8 /100 | #257 | Tragic 63.3% |
| Immigrants | Barbados | 0.7 /100 | #258 | Tragic 63.2% |
| Immigrants | Western Europe | 0.6 /100 | #259 | Tragic 63.2% |
| Cypriots | 0.6 /100 | #260 | Tragic 63.2% |
| Immigrants | Russia | 0.6 /100 | #261 | Tragic 63.2% |
| Immigrants | Ireland | 0.6 /100 | #262 | Tragic 63.2% |
| Cheyenne | 0.5 /100 | #263 | Tragic 63.2% |
| Kenyans | 0.5 /100 | #264 | Tragic 63.2% |
Demographics Similar to Nigerians by Family Households
In terms of family households, the demographic groups most similar to Nigerians are Immigrants from Bangladesh (63.9%, a difference of 0.0%), Sierra Leonean (63.9%, a difference of 0.010%), Immigrants from Lithuania (63.9%, a difference of 0.020%), Brazilian (63.9%, a difference of 0.030%), and Immigrants from Uruguay (63.9%, a difference of 0.040%).
| Demographics | Rating | Rank | Family Households |
| Immigrants | Malaysia | 17.9 /100 | #200 | Poor 64.0% |
| Immigrants | Eastern Europe | 17.2 /100 | #201 | Poor 64.0% |
| Iranians | 13.5 /100 | #202 | Poor 63.9% |
| Norwegians | 13.2 /100 | #203 | Poor 63.9% |
| Immigrants | Uruguay | 12.8 /100 | #204 | Poor 63.9% |
| Brazilians | 12.4 /100 | #205 | Poor 63.9% |
| Immigrants | Lithuania | 12.1 /100 | #206 | Poor 63.9% |
| Nigerians | 11.5 /100 | #207 | Poor 63.9% |
| Immigrants | Bangladesh | 11.4 /100 | #208 | Poor 63.9% |
| Sierra Leoneans | 11.2 /100 | #209 | Poor 63.9% |
| Immigrants | Thailand | 9.6 /100 | #210 | Tragic 63.8% |
| Shoshone | 9.4 /100 | #211 | Tragic 63.8% |
| Immigrants | Netherlands | 9.4 /100 | #212 | Tragic 63.8% |
| Immigrants | Northern Europe | 8.8 /100 | #213 | Tragic 63.8% |
| Celtics | 8.0 /100 | #214 | Tragic 63.8% |