Icelander vs Immigrants from Peru Professional Degree
COMPARE
Icelander
Immigrants from Peru
Professional Degree
Professional Degree Comparison
Icelanders
Immigrants from Peru
4.8%
PROFESSIONAL DEGREE
91.5/ 100
METRIC RATING
130th/ 347
METRIC RANK
4.4%
PROFESSIONAL DEGREE
49.3/ 100
METRIC RATING
176th/ 347
METRIC RANK
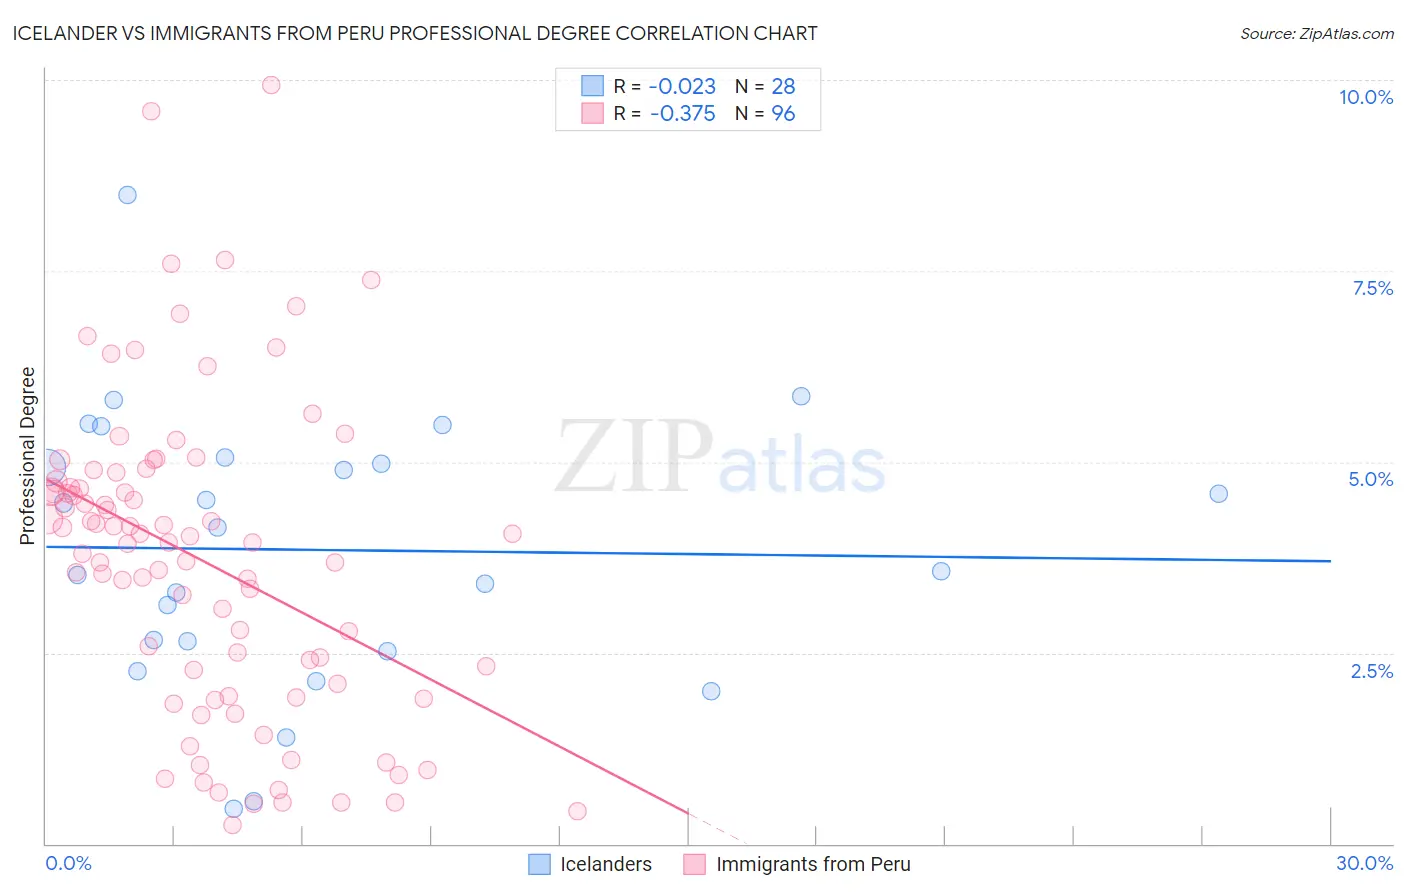
Icelander vs Immigrants from Peru Professional Degree Correlation Chart
The statistical analysis conducted on geographies consisting of 159,480,719 people shows no correlation between the proportion of Icelanders and percentage of population with at least professional degree education in the United States with a correlation coefficient (R) of -0.023 and weighted average of 4.8%. Similarly, the statistical analysis conducted on geographies consisting of 328,575,904 people shows a mild negative correlation between the proportion of Immigrants from Peru and percentage of population with at least professional degree education in the United States with a correlation coefficient (R) of -0.375 and weighted average of 4.4%, a difference of 8.7%.
Professional Degree Correlation Summary
| Measurement | Icelander | Immigrants from Peru |
| Minimum | 0.47% | 0.24% |
| Maximum | 8.5% | 9.9% |
| Range | 8.0% | 9.7% |
| Mean | 3.8% | 3.7% |
| Median | 3.9% | 3.9% |
| Interquartile 25% (IQ1) | 2.6% | 2.0% |
| Interquartile 75% (IQ3) | 5.0% | 4.7% |
| Interquartile Range (IQR) | 2.4% | 2.7% |
| Standard Deviation (Sample) | 1.8% | 2.0% |
| Standard Deviation (Population) | 1.8% | 2.0% |
Similar Demographics by Professional Degree
Demographics Similar to Icelanders by Professional Degree
In terms of professional degree, the demographic groups most similar to Icelanders are Palestinian (4.8%, a difference of 0.030%), Immigrants from Nepal (4.8%, a difference of 0.030%), Pakistani (4.8%, a difference of 0.25%), Immigrants from Eastern Africa (4.8%, a difference of 0.48%), and Serbian (4.8%, a difference of 0.50%).
| Demographics | Rating | Rank | Professional Degree |
| Immigrants | Venezuela | 93.8 /100 | #123 | Exceptional 4.8% |
| Immigrants | Eritrea | 93.5 /100 | #124 | Exceptional 4.8% |
| Immigrants | Albania | 93.3 /100 | #125 | Exceptional 4.8% |
| Europeans | 93.2 /100 | #126 | Exceptional 4.8% |
| Serbians | 92.6 /100 | #127 | Exceptional 4.8% |
| Immigrants | Eastern Africa | 92.5 /100 | #128 | Exceptional 4.8% |
| Palestinians | 91.5 /100 | #129 | Exceptional 4.8% |
| Icelanders | 91.5 /100 | #130 | Exceptional 4.8% |
| Immigrants | Nepal | 91.4 /100 | #131 | Exceptional 4.8% |
| Pakistanis | 90.9 /100 | #132 | Exceptional 4.8% |
| Italians | 90.2 /100 | #133 | Exceptional 4.8% |
| South American Indians | 89.9 /100 | #134 | Excellent 4.8% |
| Macedonians | 89.8 /100 | #135 | Excellent 4.8% |
| Immigrants | Jordan | 89.0 /100 | #136 | Excellent 4.7% |
| Jordanians | 88.9 /100 | #137 | Excellent 4.7% |
Demographics Similar to Immigrants from Peru by Professional Degree
In terms of professional degree, the demographic groups most similar to Immigrants from Peru are Kenyan (4.4%, a difference of 0.10%), Irish (4.4%, a difference of 0.10%), English (4.4%, a difference of 0.11%), Celtic (4.4%, a difference of 0.25%), and Spaniard (4.4%, a difference of 0.39%).
| Demographics | Rating | Rank | Professional Degree |
| Chinese | 58.6 /100 | #169 | Average 4.5% |
| Immigrants | Zaire | 57.4 /100 | #170 | Average 4.5% |
| Immigrants | Bangladesh | 56.0 /100 | #171 | Average 4.4% |
| Spaniards | 52.0 /100 | #172 | Average 4.4% |
| English | 50.1 /100 | #173 | Average 4.4% |
| Kenyans | 50.0 /100 | #174 | Average 4.4% |
| Irish | 50.0 /100 | #175 | Average 4.4% |
| Immigrants | Peru | 49.3 /100 | #176 | Average 4.4% |
| Celtics | 47.6 /100 | #177 | Average 4.4% |
| Immigrants | Costa Rica | 46.7 /100 | #178 | Average 4.4% |
| Immigrants | Kenya | 45.9 /100 | #179 | Average 4.4% |
| Czechs | 44.9 /100 | #180 | Average 4.4% |
| Danes | 43.5 /100 | #181 | Average 4.4% |
| Immigrants | Immigrants | 43.2 /100 | #182 | Average 4.4% |
| Bermudans | 43.1 /100 | #183 | Average 4.4% |