Icelander vs German Russian Family Households
COMPARE
Icelander
German Russian
Family Households
Family Households Comparison
Icelanders
German Russians
63.3%
FAMILY HOUSEHOLDS
0.8/ 100
METRIC RATING
257th/ 347
METRIC RANK
60.9%
FAMILY HOUSEHOLDS
0.0/ 100
METRIC RATING
336th/ 347
METRIC RANK
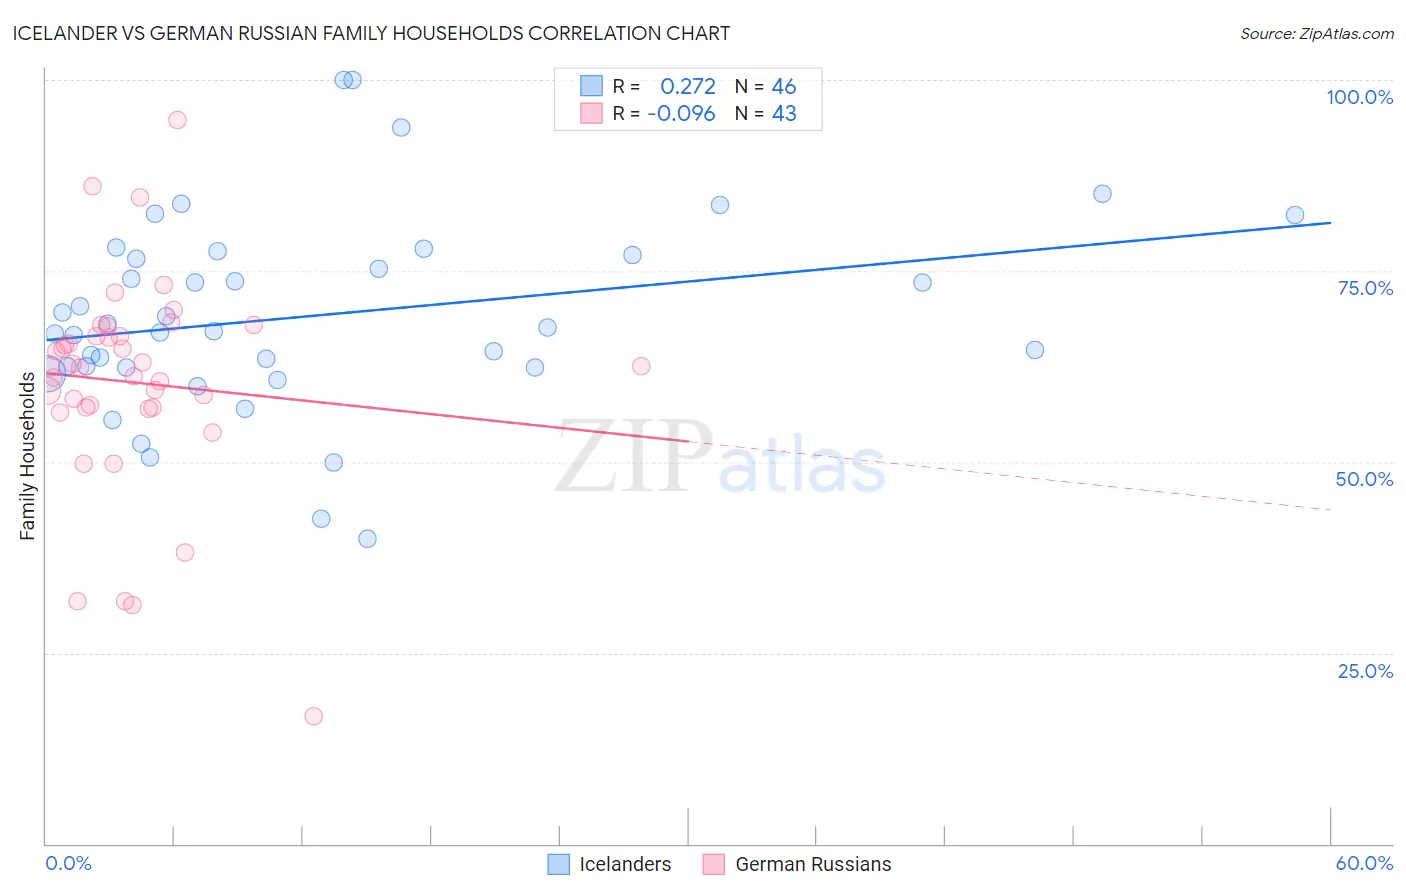
Icelander vs German Russian Family Households Correlation Chart
The statistical analysis conducted on geographies consisting of 159,626,619 people shows a weak positive correlation between the proportion of Icelanders and percentage of family households in the United States with a correlation coefficient (R) of 0.272 and weighted average of 63.3%. Similarly, the statistical analysis conducted on geographies consisting of 96,451,375 people shows a slight negative correlation between the proportion of German Russians and percentage of family households in the United States with a correlation coefficient (R) of -0.096 and weighted average of 60.9%, a difference of 3.9%.
Family Households Correlation Summary
| Measurement | Icelander | German Russian |
| Minimum | 40.0% | 16.7% |
| Maximum | 100.0% | 94.7% |
| Range | 60.0% | 78.1% |
| Mean | 69.1% | 60.4% |
| Median | 67.3% | 62.5% |
| Interquartile 25% (IQ1) | 62.3% | 57.1% |
| Interquartile 75% (IQ3) | 77.1% | 66.4% |
| Interquartile Range (IQR) | 14.8% | 9.4% |
| Standard Deviation (Sample) | 12.9% | 14.2% |
| Standard Deviation (Population) | 12.7% | 14.1% |
Similar Demographics by Family Households
Demographics Similar to Icelanders by Family Households
In terms of family households, the demographic groups most similar to Icelanders are Luxembourger (63.3%, a difference of 0.040%), Potawatomi (63.3%, a difference of 0.060%), Immigrants from Barbados (63.2%, a difference of 0.070%), Immigrants from Western Europe (63.2%, a difference of 0.070%), and Immigrants from Dominican Republic (63.3%, a difference of 0.090%).
| Demographics | Rating | Rank | Family Households |
| Immigrants | Japan | 1.4 /100 | #250 | Tragic 63.4% |
| Taiwanese | 1.2 /100 | #251 | Tragic 63.3% |
| Bahamians | 1.1 /100 | #252 | Tragic 63.3% |
| Immigrants | Dominican Republic | 1.0 /100 | #253 | Tragic 63.3% |
| Slovaks | 1.0 /100 | #254 | Tragic 63.3% |
| Potawatomi | 1.0 /100 | #255 | Tragic 63.3% |
| Luxembourgers | 0.9 /100 | #256 | Tragic 63.3% |
| Icelanders | 0.8 /100 | #257 | Tragic 63.3% |
| Immigrants | Barbados | 0.7 /100 | #258 | Tragic 63.2% |
| Immigrants | Western Europe | 0.6 /100 | #259 | Tragic 63.2% |
| Cypriots | 0.6 /100 | #260 | Tragic 63.2% |
| Immigrants | Russia | 0.6 /100 | #261 | Tragic 63.2% |
| Immigrants | Ireland | 0.6 /100 | #262 | Tragic 63.2% |
| Cheyenne | 0.5 /100 | #263 | Tragic 63.2% |
| Kenyans | 0.5 /100 | #264 | Tragic 63.2% |
Demographics Similar to German Russians by Family Households
In terms of family households, the demographic groups most similar to German Russians are Soviet Union (60.9%, a difference of 0.0%), Immigrants from Eritrea (60.8%, a difference of 0.14%), Carpatho Rusyn (61.1%, a difference of 0.28%), Immigrants from Saudi Arabia (60.7%, a difference of 0.35%), and Immigrants from Eastern Africa (61.1%, a difference of 0.40%).
| Demographics | Rating | Rank | Family Households |
| Cambodians | 0.0 /100 | #329 | Tragic 61.4% |
| Immigrants | Australia | 0.0 /100 | #330 | Tragic 61.3% |
| Immigrants | France | 0.0 /100 | #331 | Tragic 61.3% |
| Ethiopians | 0.0 /100 | #332 | Tragic 61.2% |
| Immigrants | Ethiopia | 0.0 /100 | #333 | Tragic 61.2% |
| Immigrants | Eastern Africa | 0.0 /100 | #334 | Tragic 61.1% |
| Carpatho Rusyns | 0.0 /100 | #335 | Tragic 61.1% |
| German Russians | 0.0 /100 | #336 | Tragic 60.9% |
| Soviet Union | 0.0 /100 | #337 | Tragic 60.9% |
| Immigrants | Eritrea | 0.0 /100 | #338 | Tragic 60.8% |
| Immigrants | Saudi Arabia | 0.0 /100 | #339 | Tragic 60.7% |
| Immigrants | Sudan | 0.0 /100 | #340 | Tragic 60.2% |
| Immigrants | Senegal | 0.0 /100 | #341 | Tragic 60.1% |
| Sudanese | 0.0 /100 | #342 | Tragic 60.0% |
| Senegalese | 0.0 /100 | #343 | Tragic 59.8% |