Arapaho vs Immigrants from Peru Family Households
COMPARE
Arapaho
Immigrants from Peru
Family Households
Family Households Comparison
Arapaho
Immigrants from Peru
66.5%
FAMILY HOUSEHOLDS
100.0/ 100
METRIC RATING
46th/ 347
METRIC RANK
67.2%
FAMILY HOUSEHOLDS
100.0/ 100
METRIC RATING
30th/ 347
METRIC RANK
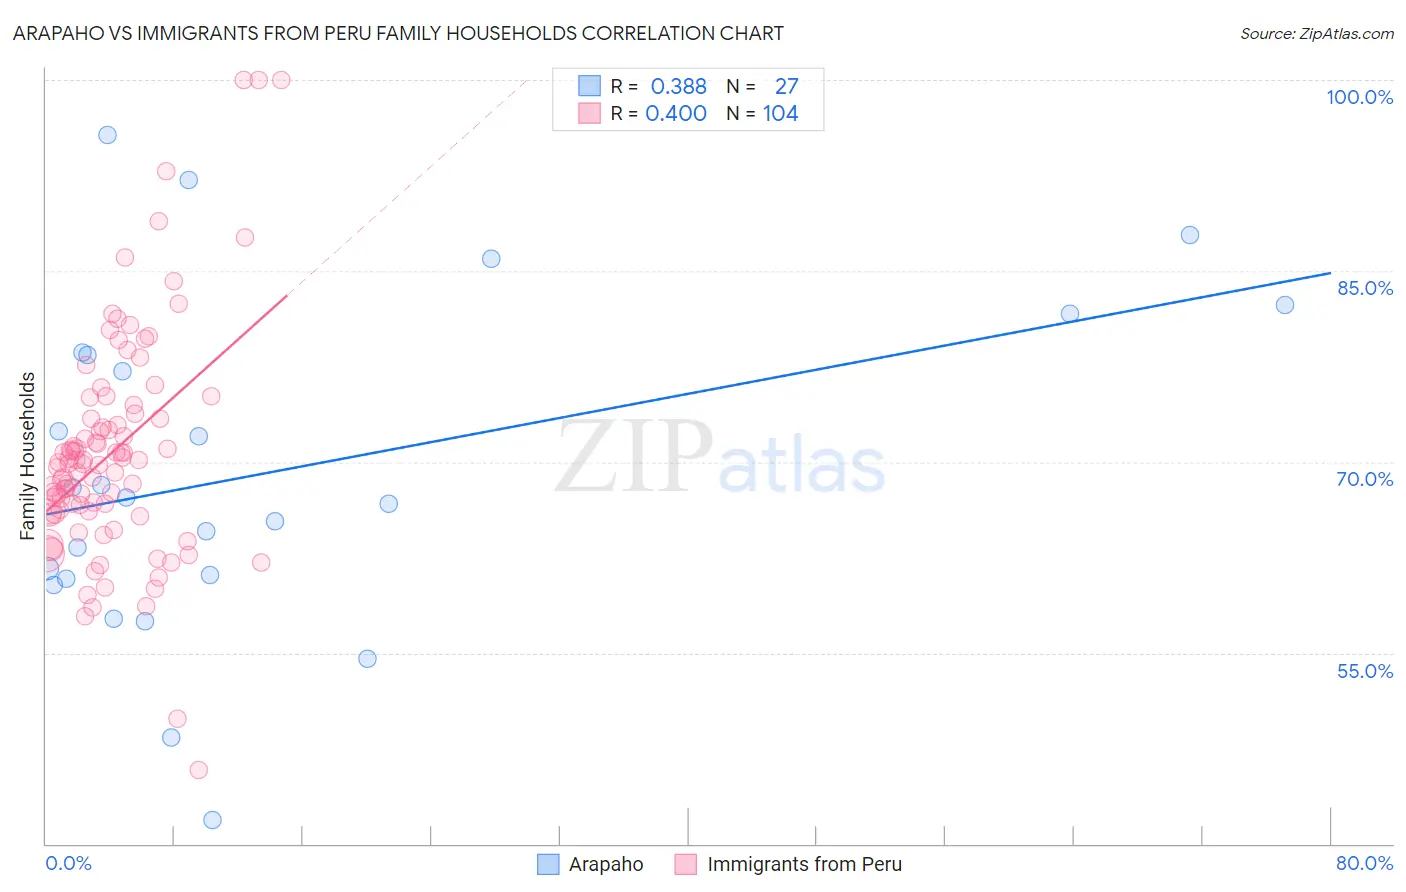
Arapaho vs Immigrants from Peru Family Households Correlation Chart
The statistical analysis conducted on geographies consisting of 29,778,233 people shows a mild positive correlation between the proportion of Arapaho and percentage of family households in the United States with a correlation coefficient (R) of 0.388 and weighted average of 66.5%. Similarly, the statistical analysis conducted on geographies consisting of 328,761,314 people shows a mild positive correlation between the proportion of Immigrants from Peru and percentage of family households in the United States with a correlation coefficient (R) of 0.400 and weighted average of 67.2%, a difference of 1.1%.
Family Households Correlation Summary
| Measurement | Arapaho | Immigrants from Peru |
| Minimum | 41.9% | 45.8% |
| Maximum | 95.7% | 100.0% |
| Range | 53.8% | 54.2% |
| Mean | 69.3% | 70.8% |
| Median | 67.2% | 69.9% |
| Interquartile 25% (IQ1) | 60.8% | 66.1% |
| Interquartile 75% (IQ3) | 78.6% | 73.6% |
| Interquartile Range (IQR) | 17.8% | 7.5% |
| Standard Deviation (Sample) | 13.1% | 9.0% |
| Standard Deviation (Population) | 12.9% | 8.9% |
Demographics Similar to Arapaho and Immigrants from Peru by Family Households
In terms of family households, the demographic groups most similar to Arapaho are Venezuelan (66.5%, a difference of 0.020%), Bolivian (66.5%, a difference of 0.030%), Asian (66.5%, a difference of 0.050%), Immigrants from Venezuela (66.4%, a difference of 0.050%), and Apache (66.5%, a difference of 0.090%). Similarly, the demographic groups most similar to Immigrants from Peru are Immigrants from Latin America (67.2%, a difference of 0.010%), Nepalese (67.2%, a difference of 0.070%), Salvadoran (67.2%, a difference of 0.11%), Thai (67.2%, a difference of 0.12%), and Tohono O'odham (67.1%, a difference of 0.17%).
| Demographics | Rating | Rank | Family Households |
| Hawaiians | 100.0 /100 | #28 | Exceptional 67.4% |
| Nicaraguans | 100.0 /100 | #29 | Exceptional 67.4% |
| Immigrants | Peru | 100.0 /100 | #30 | Exceptional 67.2% |
| Immigrants | Latin America | 100.0 /100 | #31 | Exceptional 67.2% |
| Nepalese | 100.0 /100 | #32 | Exceptional 67.2% |
| Salvadorans | 100.0 /100 | #33 | Exceptional 67.2% |
| Thais | 100.0 /100 | #34 | Exceptional 67.2% |
| Tohono O'odham | 100.0 /100 | #35 | Exceptional 67.1% |
| Peruvians | 100.0 /100 | #36 | Exceptional 67.1% |
| Tsimshian | 100.0 /100 | #37 | Exceptional 67.1% |
| Mexican American Indians | 100.0 /100 | #38 | Exceptional 67.0% |
| Immigrants | El Salvador | 100.0 /100 | #39 | Exceptional 67.0% |
| Guamanians/Chamorros | 100.0 /100 | #40 | Exceptional 66.6% |
| Immigrants | Bolivia | 100.0 /100 | #41 | Exceptional 66.6% |
| Menominee | 100.0 /100 | #42 | Exceptional 66.5% |
| Apache | 100.0 /100 | #43 | Exceptional 66.5% |
| Asians | 100.0 /100 | #44 | Exceptional 66.5% |
| Venezuelans | 100.0 /100 | #45 | Exceptional 66.5% |
| Arapaho | 100.0 /100 | #46 | Exceptional 66.5% |
| Bolivians | 100.0 /100 | #47 | Exceptional 66.5% |
| Immigrants | Venezuela | 100.0 /100 | #48 | Exceptional 66.4% |