Icelander vs Immigrants from Europe Family Households
COMPARE
Icelander
Immigrants from Europe
Family Households
Family Households Comparison
Icelanders
Immigrants from Europe
63.3%
FAMILY HOUSEHOLDS
0.8/ 100
METRIC RATING
257th/ 347
METRIC RANK
63.7%
FAMILY HOUSEHOLDS
6.4/ 100
METRIC RATING
220th/ 347
METRIC RANK
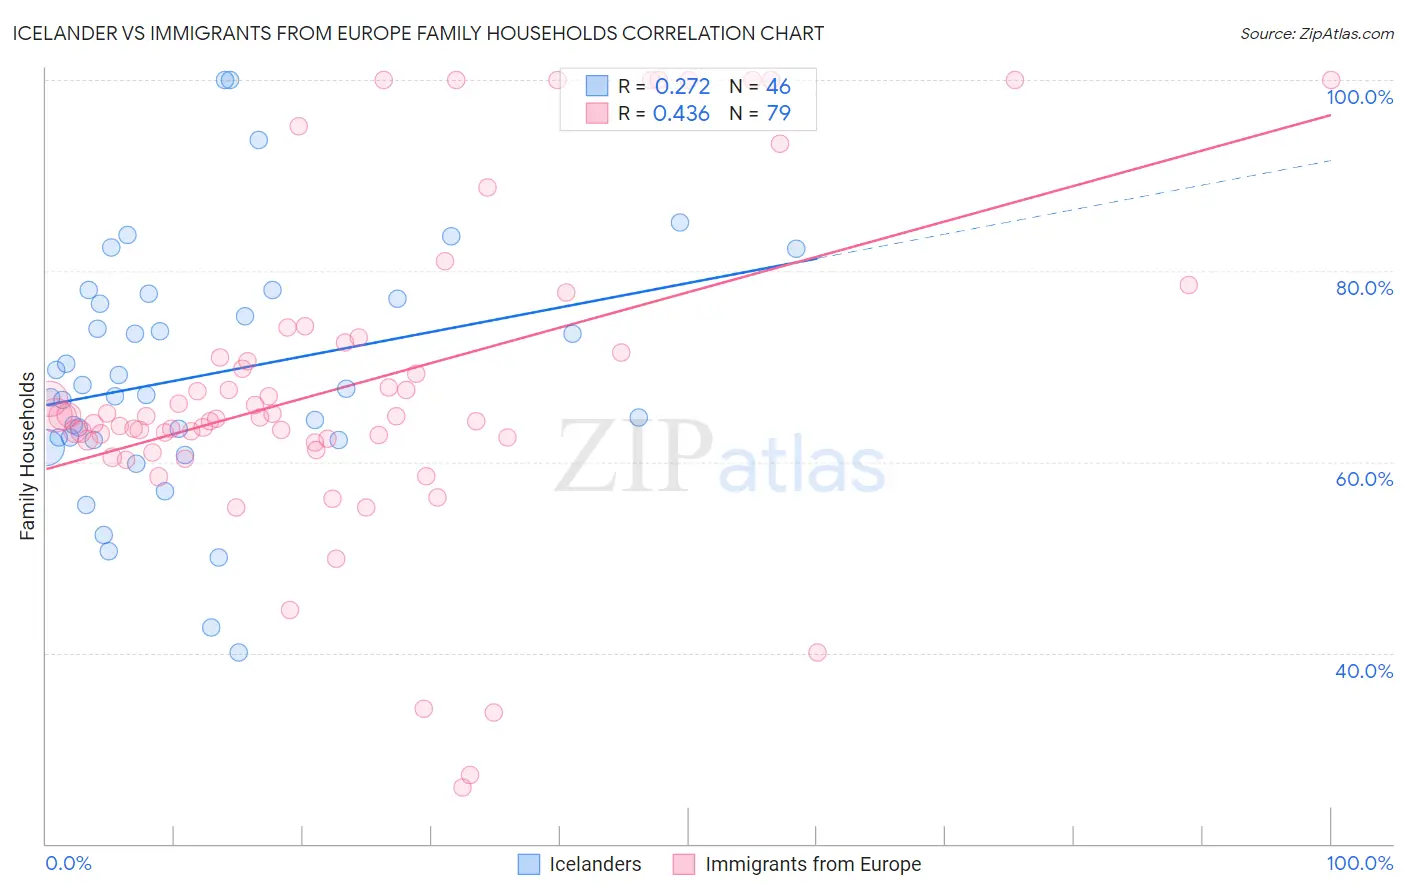
Icelander vs Immigrants from Europe Family Households Correlation Chart
The statistical analysis conducted on geographies consisting of 159,626,619 people shows a weak positive correlation between the proportion of Icelanders and percentage of family households in the United States with a correlation coefficient (R) of 0.272 and weighted average of 63.3%. Similarly, the statistical analysis conducted on geographies consisting of 546,902,993 people shows a moderate positive correlation between the proportion of Immigrants from Europe and percentage of family households in the United States with a correlation coefficient (R) of 0.436 and weighted average of 63.7%, a difference of 0.73%.
Family Households Correlation Summary
| Measurement | Icelander | Immigrants from Europe |
| Minimum | 40.0% | 25.9% |
| Maximum | 100.0% | 100.0% |
| Range | 60.0% | 74.1% |
| Mean | 69.1% | 68.1% |
| Median | 67.3% | 64.7% |
| Interquartile 25% (IQ1) | 62.3% | 62.2% |
| Interquartile 75% (IQ3) | 77.1% | 72.5% |
| Interquartile Range (IQR) | 14.8% | 10.2% |
| Standard Deviation (Sample) | 12.9% | 16.6% |
| Standard Deviation (Population) | 12.7% | 16.5% |
Similar Demographics by Family Households
Demographics Similar to Icelanders by Family Households
In terms of family households, the demographic groups most similar to Icelanders are Luxembourger (63.3%, a difference of 0.040%), Potawatomi (63.3%, a difference of 0.060%), Immigrants from Barbados (63.2%, a difference of 0.070%), Immigrants from Western Europe (63.2%, a difference of 0.070%), and Immigrants from Dominican Republic (63.3%, a difference of 0.090%).
| Demographics | Rating | Rank | Family Households |
| Immigrants | Japan | 1.4 /100 | #250 | Tragic 63.4% |
| Taiwanese | 1.2 /100 | #251 | Tragic 63.3% |
| Bahamians | 1.1 /100 | #252 | Tragic 63.3% |
| Immigrants | Dominican Republic | 1.0 /100 | #253 | Tragic 63.3% |
| Slovaks | 1.0 /100 | #254 | Tragic 63.3% |
| Potawatomi | 1.0 /100 | #255 | Tragic 63.3% |
| Luxembourgers | 0.9 /100 | #256 | Tragic 63.3% |
| Icelanders | 0.8 /100 | #257 | Tragic 63.3% |
| Immigrants | Barbados | 0.7 /100 | #258 | Tragic 63.2% |
| Immigrants | Western Europe | 0.6 /100 | #259 | Tragic 63.2% |
| Cypriots | 0.6 /100 | #260 | Tragic 63.2% |
| Immigrants | Russia | 0.6 /100 | #261 | Tragic 63.2% |
| Immigrants | Ireland | 0.6 /100 | #262 | Tragic 63.2% |
| Cheyenne | 0.5 /100 | #263 | Tragic 63.2% |
| Kenyans | 0.5 /100 | #264 | Tragic 63.2% |
Demographics Similar to Immigrants from Europe by Family Households
In terms of family households, the demographic groups most similar to Immigrants from Europe are Macedonian (63.7%, a difference of 0.010%), Immigrants from South Africa (63.7%, a difference of 0.020%), Osage (63.7%, a difference of 0.030%), Marshallese (63.7%, a difference of 0.030%), and Croatian (63.8%, a difference of 0.050%).
| Demographics | Rating | Rank | Family Households |
| Immigrants | Northern Europe | 8.8 /100 | #213 | Tragic 63.8% |
| Celtics | 8.0 /100 | #214 | Tragic 63.8% |
| Belgians | 7.6 /100 | #215 | Tragic 63.8% |
| Croatians | 7.3 /100 | #216 | Tragic 63.8% |
| Osage | 7.0 /100 | #217 | Tragic 63.7% |
| Marshallese | 6.9 /100 | #218 | Tragic 63.7% |
| Macedonians | 6.5 /100 | #219 | Tragic 63.7% |
| Immigrants | Europe | 6.4 /100 | #220 | Tragic 63.7% |
| Immigrants | South Africa | 5.9 /100 | #221 | Tragic 63.7% |
| Immigrants | Belarus | 5.5 /100 | #222 | Tragic 63.7% |
| French Canadians | 5.4 /100 | #223 | Tragic 63.7% |
| Turks | 4.5 /100 | #224 | Tragic 63.6% |
| Immigrants | Hungary | 4.3 /100 | #225 | Tragic 63.6% |
| Immigrants | Bahamas | 4.2 /100 | #226 | Tragic 63.6% |
| Trinidadians and Tobagonians | 4.1 /100 | #227 | Tragic 63.6% |