Icelander vs Luxembourger Family Households
COMPARE
Icelander
Luxembourger
Family Households
Family Households Comparison
Icelanders
Luxembourgers
63.3%
FAMILY HOUSEHOLDS
0.8/ 100
METRIC RATING
257th/ 347
METRIC RANK
63.3%
FAMILY HOUSEHOLDS
0.9/ 100
METRIC RATING
256th/ 347
METRIC RANK
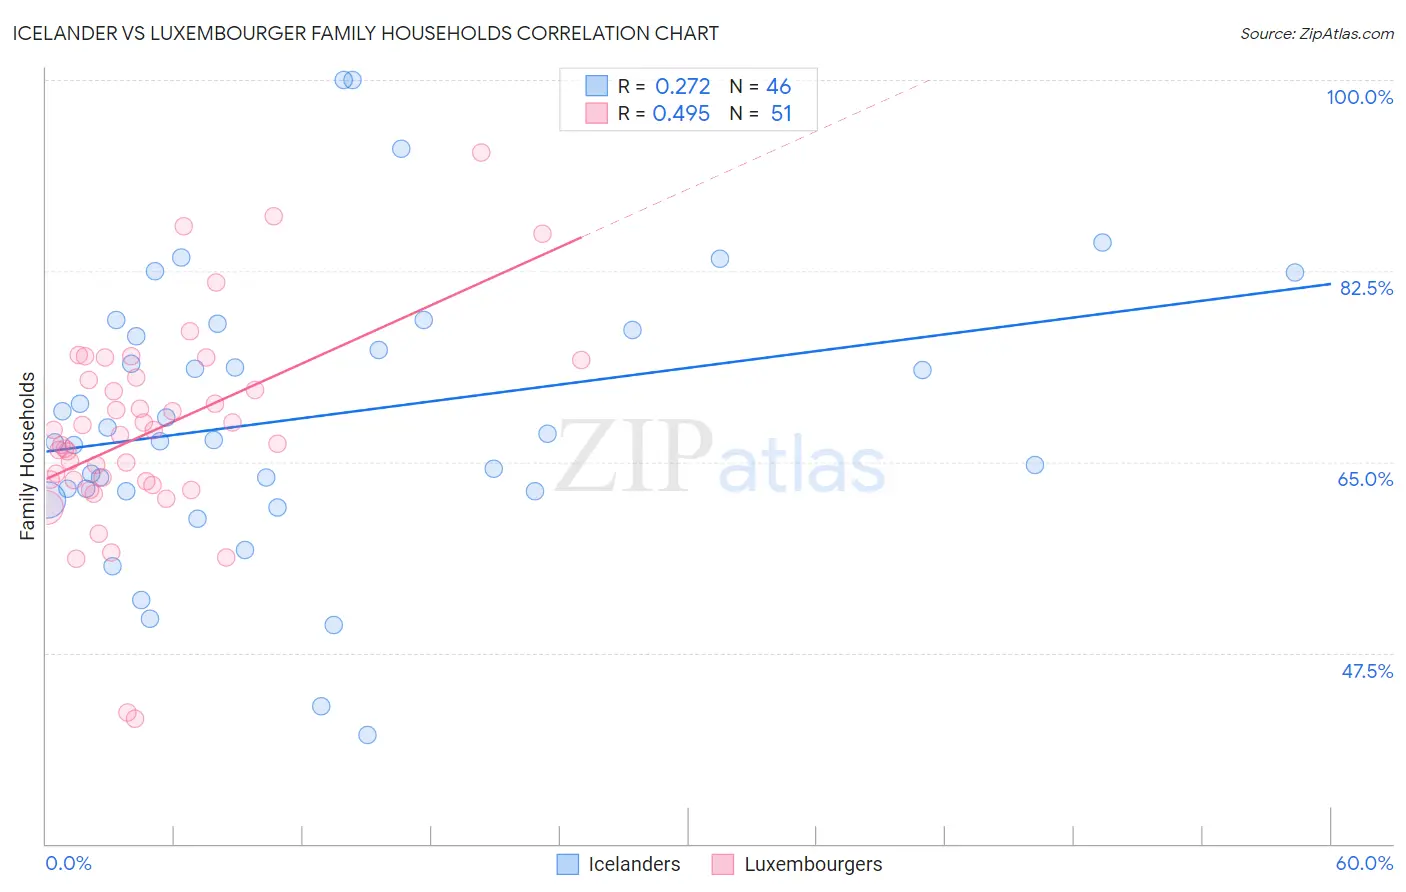
Icelander vs Luxembourger Family Households Correlation Chart
The statistical analysis conducted on geographies consisting of 159,626,619 people shows a weak positive correlation between the proportion of Icelanders and percentage of family households in the United States with a correlation coefficient (R) of 0.272 and weighted average of 63.3%. Similarly, the statistical analysis conducted on geographies consisting of 144,654,456 people shows a moderate positive correlation between the proportion of Luxembourgers and percentage of family households in the United States with a correlation coefficient (R) of 0.495 and weighted average of 63.3%, a difference of 0.040%.
Family Households Correlation Summary
| Measurement | Icelander | Luxembourger |
| Minimum | 40.0% | 41.4% |
| Maximum | 100.0% | 93.3% |
| Range | 60.0% | 51.9% |
| Mean | 69.1% | 67.9% |
| Median | 67.3% | 67.5% |
| Interquartile 25% (IQ1) | 62.3% | 63.2% |
| Interquartile 75% (IQ3) | 77.1% | 72.7% |
| Interquartile Range (IQR) | 14.8% | 9.5% |
| Standard Deviation (Sample) | 12.9% | 9.5% |
| Standard Deviation (Population) | 12.7% | 9.4% |
Demographics Similar to Icelanders and Luxembourgers by Family Households
In terms of family households, the demographic groups most similar to Icelanders are Potawatomi (63.3%, a difference of 0.060%), Immigrants from Barbados (63.2%, a difference of 0.070%), Immigrants from Western Europe (63.2%, a difference of 0.070%), Immigrants from Dominican Republic (63.3%, a difference of 0.090%), and Slovak (63.3%, a difference of 0.090%). Similarly, the demographic groups most similar to Luxembourgers are Potawatomi (63.3%, a difference of 0.020%), Immigrants from Dominican Republic (63.3%, a difference of 0.050%), Slovak (63.3%, a difference of 0.050%), Bahamian (63.3%, a difference of 0.080%), and Taiwanese (63.3%, a difference of 0.090%).
| Demographics | Rating | Rank | Family Households |
| Immigrants | Ghana | 1.6 /100 | #246 | Tragic 63.4% |
| Immigrants | Uzbekistan | 1.5 /100 | #247 | Tragic 63.4% |
| Dominicans | 1.5 /100 | #248 | Tragic 63.4% |
| Russians | 1.4 /100 | #249 | Tragic 63.4% |
| Immigrants | Japan | 1.4 /100 | #250 | Tragic 63.4% |
| Taiwanese | 1.2 /100 | #251 | Tragic 63.3% |
| Bahamians | 1.1 /100 | #252 | Tragic 63.3% |
| Immigrants | Dominican Republic | 1.0 /100 | #253 | Tragic 63.3% |
| Slovaks | 1.0 /100 | #254 | Tragic 63.3% |
| Potawatomi | 1.0 /100 | #255 | Tragic 63.3% |
| Luxembourgers | 0.9 /100 | #256 | Tragic 63.3% |
| Icelanders | 0.8 /100 | #257 | Tragic 63.3% |
| Immigrants | Barbados | 0.7 /100 | #258 | Tragic 63.2% |
| Immigrants | Western Europe | 0.6 /100 | #259 | Tragic 63.2% |
| Cypriots | 0.6 /100 | #260 | Tragic 63.2% |
| Immigrants | Russia | 0.6 /100 | #261 | Tragic 63.2% |
| Immigrants | Ireland | 0.6 /100 | #262 | Tragic 63.2% |
| Cheyenne | 0.5 /100 | #263 | Tragic 63.2% |
| Kenyans | 0.5 /100 | #264 | Tragic 63.2% |
| Colville | 0.5 /100 | #265 | Tragic 63.2% |
| Immigrants | Western Africa | 0.5 /100 | #266 | Tragic 63.1% |