Icelander vs Immigrants from Bulgaria Family Households
COMPARE
Icelander
Immigrants from Bulgaria
Family Households
Family Households Comparison
Icelanders
Immigrants from Bulgaria
63.3%
FAMILY HOUSEHOLDS
0.8/ 100
METRIC RATING
257th/ 347
METRIC RANK
63.0%
FAMILY HOUSEHOLDS
0.2/ 100
METRIC RATING
280th/ 347
METRIC RANK
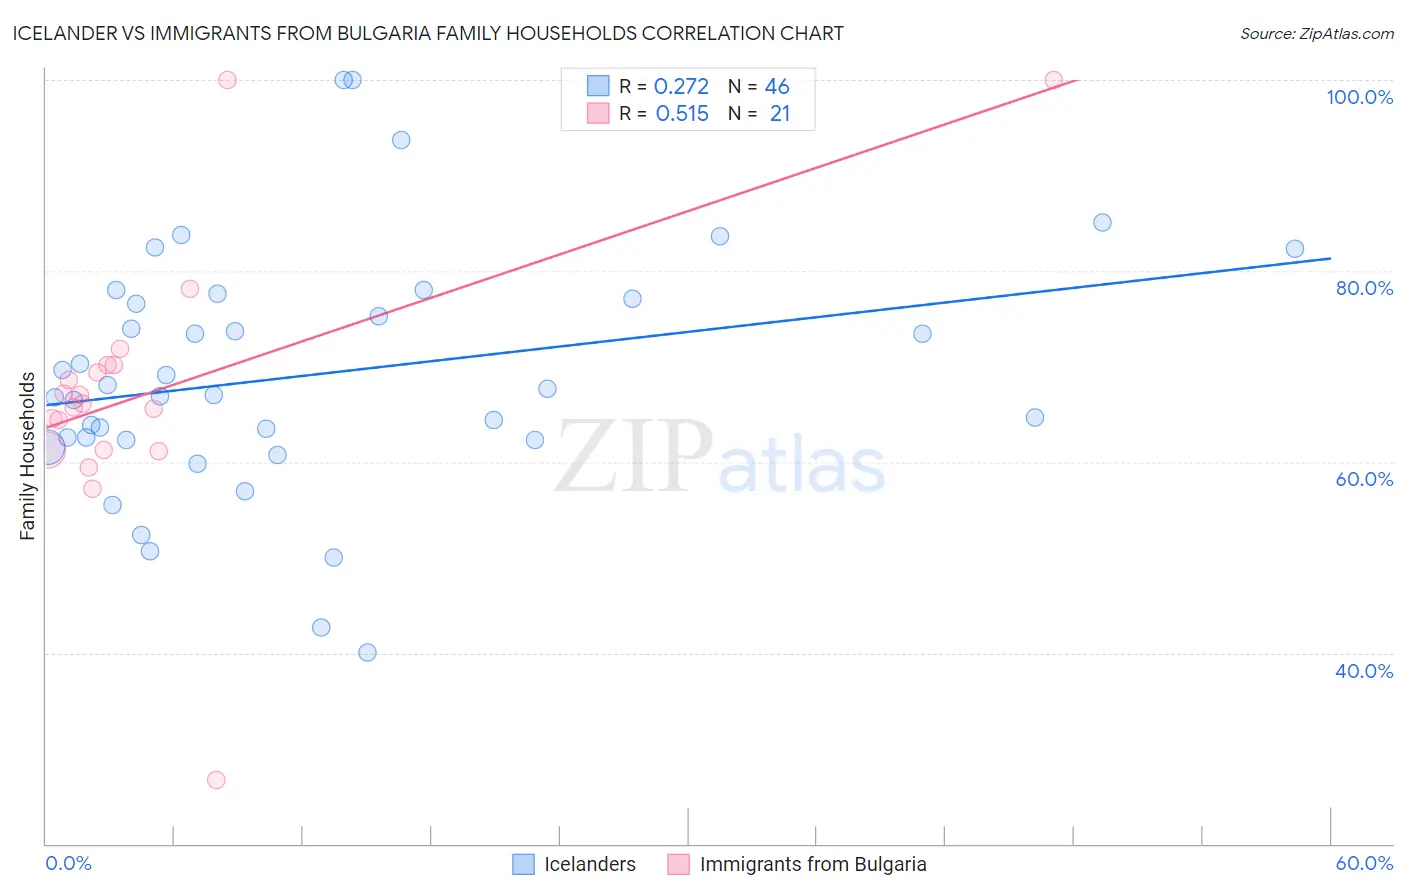
Icelander vs Immigrants from Bulgaria Family Households Correlation Chart
The statistical analysis conducted on geographies consisting of 159,626,619 people shows a weak positive correlation between the proportion of Icelanders and percentage of family households in the United States with a correlation coefficient (R) of 0.272 and weighted average of 63.3%. Similarly, the statistical analysis conducted on geographies consisting of 172,541,029 people shows a substantial positive correlation between the proportion of Immigrants from Bulgaria and percentage of family households in the United States with a correlation coefficient (R) of 0.515 and weighted average of 63.0%, a difference of 0.48%.
Family Households Correlation Summary
| Measurement | Icelander | Immigrants from Bulgaria |
| Minimum | 40.0% | 26.6% |
| Maximum | 100.0% | 100.0% |
| Range | 60.0% | 73.4% |
| Mean | 69.1% | 67.4% |
| Median | 67.3% | 66.1% |
| Interquartile 25% (IQ1) | 62.3% | 61.2% |
| Interquartile 75% (IQ3) | 77.1% | 70.1% |
| Interquartile Range (IQR) | 14.8% | 8.9% |
| Standard Deviation (Sample) | 12.9% | 14.6% |
| Standard Deviation (Population) | 12.7% | 14.2% |
Similar Demographics by Family Households
Demographics Similar to Icelanders by Family Households
In terms of family households, the demographic groups most similar to Icelanders are Luxembourger (63.3%, a difference of 0.040%), Potawatomi (63.3%, a difference of 0.060%), Immigrants from Barbados (63.2%, a difference of 0.070%), Immigrants from Western Europe (63.2%, a difference of 0.070%), and Immigrants from Dominican Republic (63.3%, a difference of 0.090%).
| Demographics | Rating | Rank | Family Households |
| Immigrants | Japan | 1.4 /100 | #250 | Tragic 63.4% |
| Taiwanese | 1.2 /100 | #251 | Tragic 63.3% |
| Bahamians | 1.1 /100 | #252 | Tragic 63.3% |
| Immigrants | Dominican Republic | 1.0 /100 | #253 | Tragic 63.3% |
| Slovaks | 1.0 /100 | #254 | Tragic 63.3% |
| Potawatomi | 1.0 /100 | #255 | Tragic 63.3% |
| Luxembourgers | 0.9 /100 | #256 | Tragic 63.3% |
| Icelanders | 0.8 /100 | #257 | Tragic 63.3% |
| Immigrants | Barbados | 0.7 /100 | #258 | Tragic 63.2% |
| Immigrants | Western Europe | 0.6 /100 | #259 | Tragic 63.2% |
| Cypriots | 0.6 /100 | #260 | Tragic 63.2% |
| Immigrants | Russia | 0.6 /100 | #261 | Tragic 63.2% |
| Immigrants | Ireland | 0.6 /100 | #262 | Tragic 63.2% |
| Cheyenne | 0.5 /100 | #263 | Tragic 63.2% |
| Kenyans | 0.5 /100 | #264 | Tragic 63.2% |
Demographics Similar to Immigrants from Bulgaria by Family Households
In terms of family households, the demographic groups most similar to Immigrants from Bulgaria are Immigrants from Yemen (63.0%, a difference of 0.010%), Immigrants from Belgium (63.0%, a difference of 0.050%), Ottawa (63.0%, a difference of 0.090%), Estonian (62.9%, a difference of 0.090%), and New Zealander (62.9%, a difference of 0.13%).
| Demographics | Rating | Rank | Family Households |
| Immigrants | Kazakhstan | 0.3 /100 | #273 | Tragic 63.1% |
| Lumbee | 0.3 /100 | #274 | Tragic 63.1% |
| West Indians | 0.3 /100 | #275 | Tragic 63.1% |
| Serbians | 0.3 /100 | #276 | Tragic 63.0% |
| Ottawa | 0.3 /100 | #277 | Tragic 63.0% |
| Immigrants | Belgium | 0.2 /100 | #278 | Tragic 63.0% |
| Immigrants | Yemen | 0.2 /100 | #279 | Tragic 63.0% |
| Immigrants | Bulgaria | 0.2 /100 | #280 | Tragic 63.0% |
| Estonians | 0.2 /100 | #281 | Tragic 62.9% |
| New Zealanders | 0.1 /100 | #282 | Tragic 62.9% |
| Immigrants | Denmark | 0.1 /100 | #283 | Tragic 62.9% |
| Australians | 0.1 /100 | #284 | Tragic 62.8% |
| Mongolians | 0.1 /100 | #285 | Tragic 62.8% |
| British West Indians | 0.1 /100 | #286 | Tragic 62.8% |
| Latvians | 0.1 /100 | #287 | Tragic 62.8% |