Ottawa vs Immigrants from Western Europe Divorced or Separated
COMPARE
Ottawa
Immigrants from Western Europe
Divorced or Separated
Divorced or Separated Comparison
Ottawa
Immigrants from Western Europe
13.2%
DIVORCED OR SEPARATED
0.0/ 100
METRIC RATING
308th/ 347
METRIC RANK
12.1%
DIVORCED OR SEPARATED
45.6/ 100
METRIC RATING
179th/ 347
METRIC RANK
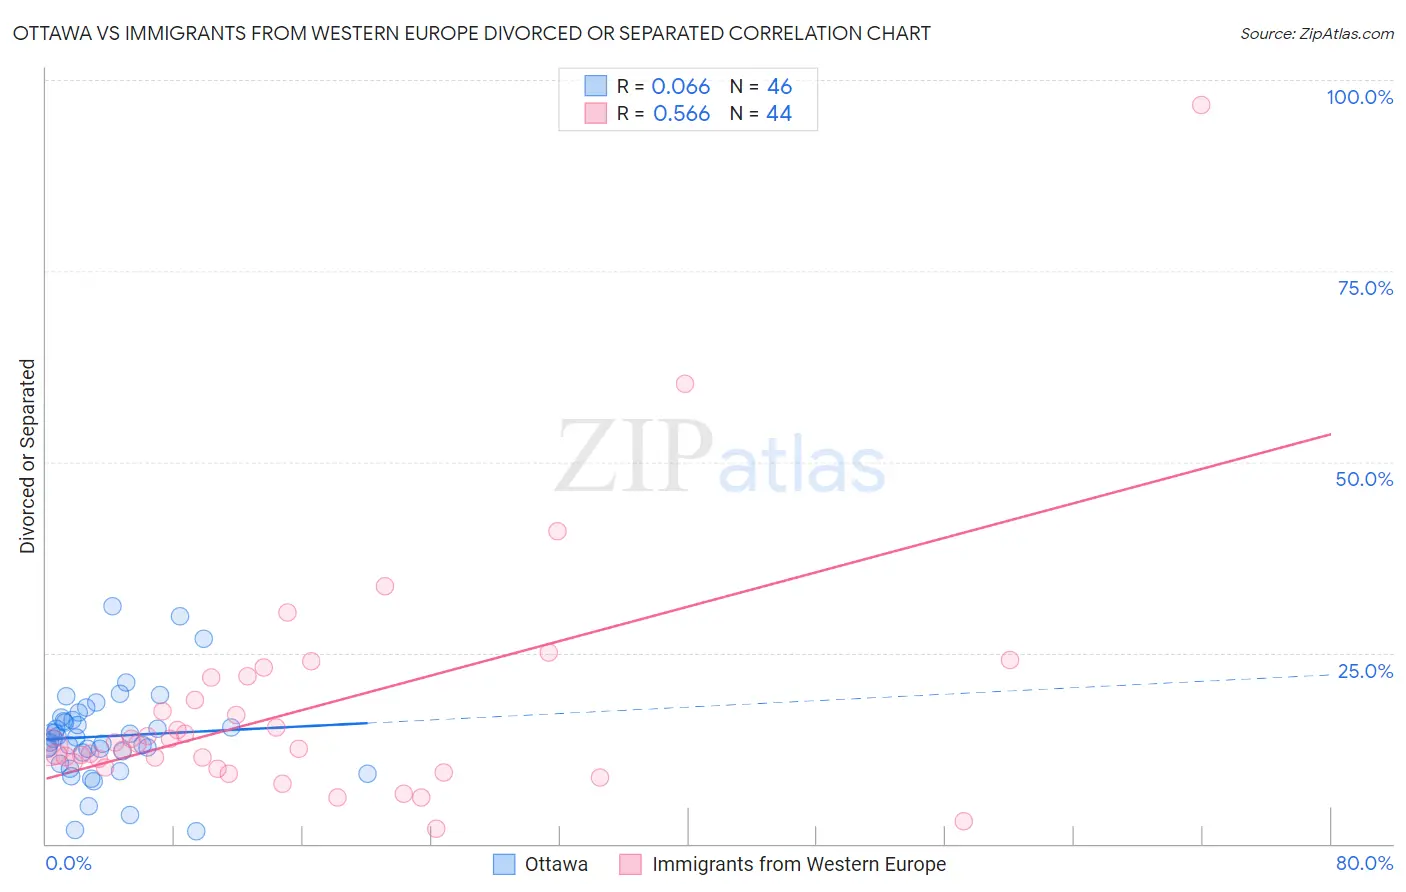
Ottawa vs Immigrants from Western Europe Divorced or Separated Correlation Chart
The statistical analysis conducted on geographies consisting of 49,956,568 people shows a slight positive correlation between the proportion of Ottawa and percentage of population currently divorced or separated in the United States with a correlation coefficient (R) of 0.066 and weighted average of 13.2%. Similarly, the statistical analysis conducted on geographies consisting of 493,891,815 people shows a substantial positive correlation between the proportion of Immigrants from Western Europe and percentage of population currently divorced or separated in the United States with a correlation coefficient (R) of 0.566 and weighted average of 12.1%, a difference of 9.6%.
Divorced or Separated Correlation Summary
| Measurement | Ottawa | Immigrants from Western Europe |
| Minimum | 1.6% | 1.9% |
| Maximum | 31.1% | 96.8% |
| Range | 29.5% | 94.9% |
| Mean | 14.1% | 17.6% |
| Median | 13.8% | 12.9% |
| Interquartile 25% (IQ1) | 11.9% | 10.3% |
| Interquartile 75% (IQ3) | 16.3% | 20.3% |
| Interquartile Range (IQR) | 4.4% | 9.9% |
| Standard Deviation (Sample) | 6.0% | 16.0% |
| Standard Deviation (Population) | 5.9% | 15.8% |
Similar Demographics by Divorced or Separated
Demographics Similar to Ottawa by Divorced or Separated
In terms of divorced or separated, the demographic groups most similar to Ottawa are American (13.2%, a difference of 0.010%), African (13.2%, a difference of 0.030%), Sioux (13.2%, a difference of 0.050%), French American Indian (13.2%, a difference of 0.090%), and Tlingit-Haida (13.2%, a difference of 0.34%).
| Demographics | Rating | Rank | Divorced or Separated |
| Alaskan Athabascans | 0.0 /100 | #301 | Tragic 13.1% |
| Immigrants | Venezuela | 0.0 /100 | #302 | Tragic 13.1% |
| Cape Verdeans | 0.0 /100 | #303 | Tragic 13.1% |
| Hopi | 0.0 /100 | #304 | Tragic 13.2% |
| Chippewa | 0.0 /100 | #305 | Tragic 13.2% |
| Tlingit-Haida | 0.0 /100 | #306 | Tragic 13.2% |
| French American Indians | 0.0 /100 | #307 | Tragic 13.2% |
| Ottawa | 0.0 /100 | #308 | Tragic 13.2% |
| Americans | 0.0 /100 | #309 | Tragic 13.2% |
| Africans | 0.0 /100 | #310 | Tragic 13.2% |
| Sioux | 0.0 /100 | #311 | Tragic 13.2% |
| Blackfeet | 0.0 /100 | #312 | Tragic 13.3% |
| Immigrants | Nicaragua | 0.0 /100 | #313 | Tragic 13.3% |
| Yaqui | 0.0 /100 | #314 | Tragic 13.3% |
| Spanish Americans | 0.0 /100 | #315 | Tragic 13.3% |
Demographics Similar to Immigrants from Western Europe by Divorced or Separated
In terms of divorced or separated, the demographic groups most similar to Immigrants from Western Europe are Ghanaian (12.1%, a difference of 0.010%), Barbadian (12.1%, a difference of 0.020%), Immigrants from Canada (12.1%, a difference of 0.050%), Brazilian (12.1%, a difference of 0.080%), and Immigrants from Ethiopia (12.1%, a difference of 0.090%).
| Demographics | Rating | Rank | Divorced or Separated |
| Immigrants | Mexico | 53.2 /100 | #172 | Average 12.0% |
| Immigrants | Moldova | 50.4 /100 | #173 | Average 12.1% |
| Hawaiians | 50.0 /100 | #174 | Average 12.1% |
| Immigrants | Sierra Leone | 50.0 /100 | #175 | Average 12.1% |
| Pennsylvania Germans | 48.9 /100 | #176 | Average 12.1% |
| Brazilians | 47.7 /100 | #177 | Average 12.1% |
| Ghanaians | 45.9 /100 | #178 | Average 12.1% |
| Immigrants | Western Europe | 45.6 /100 | #179 | Average 12.1% |
| Barbadians | 45.0 /100 | #180 | Average 12.1% |
| Immigrants | Canada | 44.0 /100 | #181 | Average 12.1% |
| Immigrants | Ethiopia | 43.1 /100 | #182 | Average 12.1% |
| Immigrants | Central America | 42.9 /100 | #183 | Average 12.1% |
| Immigrants | North America | 41.1 /100 | #184 | Average 12.1% |
| Immigrants | Nigeria | 40.5 /100 | #185 | Average 12.1% |
| Immigrants | Chile | 39.0 /100 | #186 | Fair 12.1% |