Houma vs Immigrants from Caribbean Married-couple Households
COMPARE
Houma
Immigrants from Caribbean
Married-couple Households
Married-couple Households Comparison
Houma
Immigrants from Caribbean
44.6%
MARRIED-COUPLE HOUSEHOLDS
1.5/ 100
METRIC RATING
231st/ 347
METRIC RANK
40.8%
MARRIED-COUPLE HOUSEHOLDS
0.0/ 100
METRIC RATING
316th/ 347
METRIC RANK
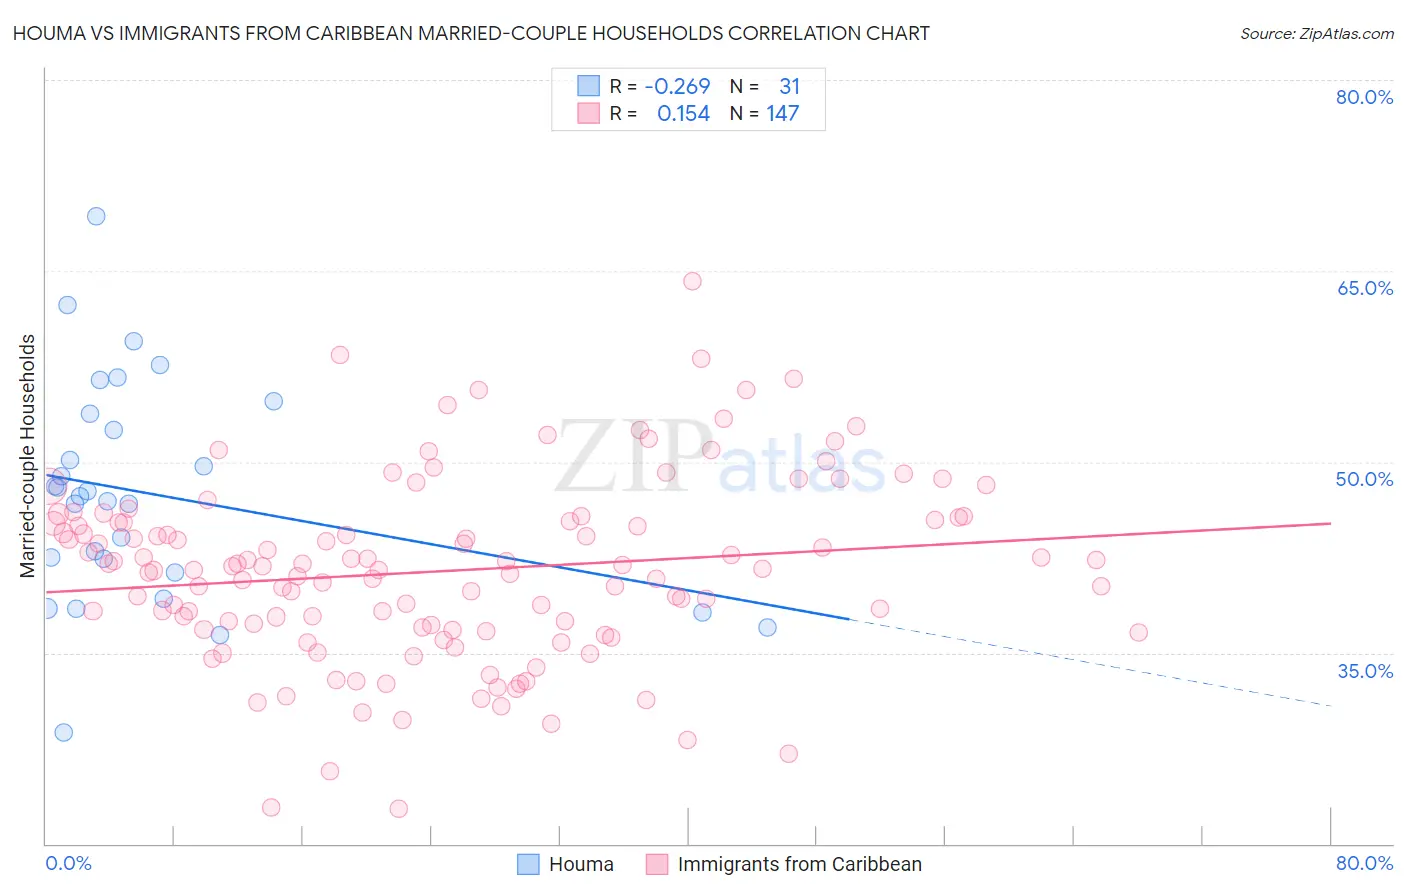
Houma vs Immigrants from Caribbean Married-couple Households Correlation Chart
The statistical analysis conducted on geographies consisting of 36,791,862 people shows a weak negative correlation between the proportion of Houma and percentage of married-couple family households in the United States with a correlation coefficient (R) of -0.269 and weighted average of 44.6%. Similarly, the statistical analysis conducted on geographies consisting of 449,664,871 people shows a poor positive correlation between the proportion of Immigrants from Caribbean and percentage of married-couple family households in the United States with a correlation coefficient (R) of 0.154 and weighted average of 40.8%, a difference of 9.5%.
Married-couple Households Correlation Summary
| Measurement | Houma | Immigrants from Caribbean |
| Minimum | 28.8% | 22.8% |
| Maximum | 69.3% | 64.2% |
| Range | 40.6% | 41.4% |
| Mean | 47.5% | 41.4% |
| Median | 47.3% | 41.7% |
| Interquartile 25% (IQ1) | 41.3% | 36.8% |
| Interquartile 75% (IQ3) | 53.8% | 45.4% |
| Interquartile Range (IQR) | 12.5% | 8.5% |
| Standard Deviation (Sample) | 8.7% | 7.2% |
| Standard Deviation (Population) | 8.5% | 7.1% |
Similar Demographics by Married-couple Households
Demographics Similar to Houma by Married-couple Households
In terms of married-couple households, the demographic groups most similar to Houma are Marshallese (44.6%, a difference of 0.0%), Soviet Union (44.6%, a difference of 0.010%), Immigrants from Uganda (44.6%, a difference of 0.040%), Immigrants from Latin America (44.7%, a difference of 0.050%), and Kenyan (44.7%, a difference of 0.10%).
| Demographics | Rating | Rank | Married-couple Households |
| Immigrants | Micronesia | 2.6 /100 | #224 | Tragic 44.9% |
| Dutch West Indians | 2.6 /100 | #225 | Tragic 44.9% |
| Alsatians | 2.3 /100 | #226 | Tragic 44.8% |
| Salvadorans | 1.9 /100 | #227 | Tragic 44.7% |
| Kenyans | 1.7 /100 | #228 | Tragic 44.7% |
| Immigrants | Latin America | 1.6 /100 | #229 | Tragic 44.7% |
| Soviet Union | 1.6 /100 | #230 | Tragic 44.6% |
| Houma | 1.5 /100 | #231 | Tragic 44.6% |
| Marshallese | 1.5 /100 | #232 | Tragic 44.6% |
| Immigrants | Uganda | 1.5 /100 | #233 | Tragic 44.6% |
| Immigrants | Panama | 1.3 /100 | #234 | Tragic 44.6% |
| Immigrants | Nicaragua | 1.2 /100 | #235 | Tragic 44.5% |
| Yaqui | 1.2 /100 | #236 | Tragic 44.5% |
| Comanche | 1.2 /100 | #237 | Tragic 44.5% |
| Immigrants | Uruguay | 1.1 /100 | #238 | Tragic 44.5% |
Demographics Similar to Immigrants from Caribbean by Married-couple Households
In terms of married-couple households, the demographic groups most similar to Immigrants from Caribbean are Trinidadian and Tobagonian (40.9%, a difference of 0.18%), Jamaican (40.9%, a difference of 0.26%), Immigrants from Jamaica (40.7%, a difference of 0.29%), Liberian (40.7%, a difference of 0.30%), and Immigrants from Haiti (40.9%, a difference of 0.34%).
| Demographics | Rating | Rank | Married-couple Households |
| Immigrants | Trinidad and Tobago | 0.0 /100 | #309 | Tragic 41.2% |
| Haitians | 0.0 /100 | #310 | Tragic 41.2% |
| Colville | 0.0 /100 | #311 | Tragic 41.0% |
| Africans | 0.0 /100 | #312 | Tragic 40.9% |
| Immigrants | Haiti | 0.0 /100 | #313 | Tragic 40.9% |
| Jamaicans | 0.0 /100 | #314 | Tragic 40.9% |
| Trinidadians and Tobagonians | 0.0 /100 | #315 | Tragic 40.9% |
| Immigrants | Caribbean | 0.0 /100 | #316 | Tragic 40.8% |
| Immigrants | Jamaica | 0.0 /100 | #317 | Tragic 40.7% |
| Liberians | 0.0 /100 | #318 | Tragic 40.7% |
| Bahamians | 0.0 /100 | #319 | Tragic 40.5% |
| West Indians | 0.0 /100 | #320 | Tragic 40.3% |
| Immigrants | Liberia | 0.0 /100 | #321 | Tragic 40.3% |
| Immigrants | Zaire | 0.0 /100 | #322 | Tragic 40.1% |
| Puerto Ricans | 0.0 /100 | #323 | Tragic 40.1% |