Houma vs Immigrants from Caribbean Unemployment Among Ages 16 to 19 years
COMPARE
Houma
Immigrants from Caribbean
Unemployment Among Ages 16 to 19 years
Unemployment Among Ages 16 to 19 years Comparison
Houma
Immigrants from Caribbean
21.6%
UNEMPLOYMENT AMONG AGES 16 TO 19 YEARS
0.0/ 100
METRIC RATING
312th/ 347
METRIC RANK
20.9%
UNEMPLOYMENT AMONG AGES 16 TO 19 YEARS
0.0/ 100
METRIC RATING
302nd/ 347
METRIC RANK
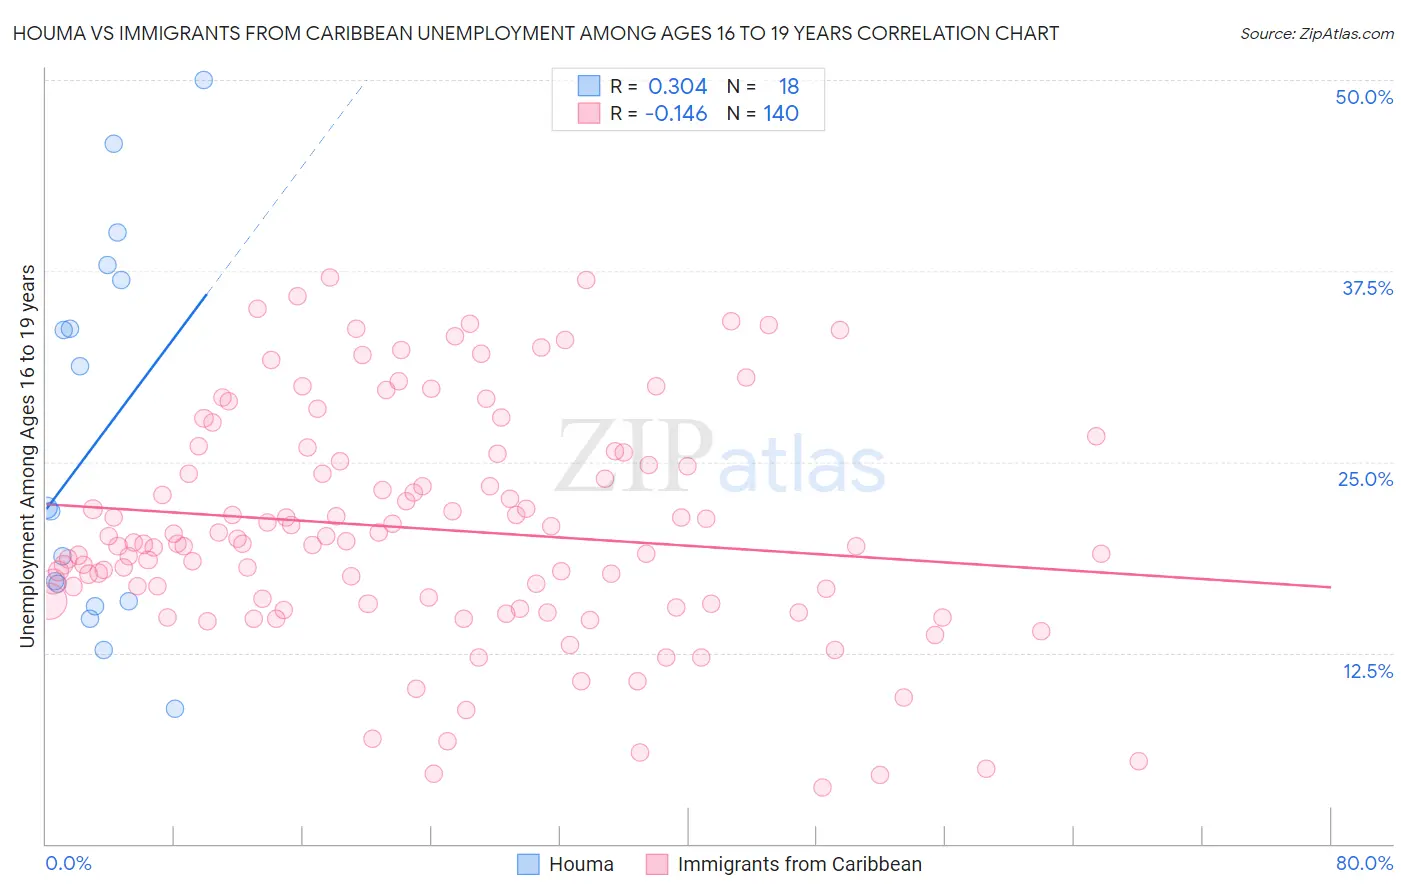
Houma vs Immigrants from Caribbean Unemployment Among Ages 16 to 19 years Correlation Chart
The statistical analysis conducted on geographies consisting of 36,075,381 people shows a mild positive correlation between the proportion of Houma and unemployment rate among population between the ages 16 and 19 in the United States with a correlation coefficient (R) of 0.304 and weighted average of 21.6%. Similarly, the statistical analysis conducted on geographies consisting of 422,539,513 people shows a poor negative correlation between the proportion of Immigrants from Caribbean and unemployment rate among population between the ages 16 and 19 in the United States with a correlation coefficient (R) of -0.146 and weighted average of 20.9%, a difference of 3.5%.
Unemployment Among Ages 16 to 19 years Correlation Summary
| Measurement | Houma | Immigrants from Caribbean |
| Minimum | 8.8% | 3.7% |
| Maximum | 50.0% | 37.1% |
| Range | 41.2% | 33.4% |
| Mean | 26.3% | 20.6% |
| Median | 21.9% | 19.7% |
| Interquartile 25% (IQ1) | 15.9% | 15.8% |
| Interquartile 75% (IQ3) | 36.9% | 25.3% |
| Interquartile Range (IQR) | 21.0% | 9.5% |
| Standard Deviation (Sample) | 12.4% | 7.4% |
| Standard Deviation (Population) | 12.1% | 7.4% |
Demographics Similar to Houma and Immigrants from Caribbean by Unemployment Among Ages 16 to 19 years
In terms of unemployment among ages 16 to 19 years, the demographic groups most similar to Houma are Belizean (21.6%, a difference of 0.26%), Jamaican (21.7%, a difference of 0.41%), Vietnamese (21.5%, a difference of 0.48%), Native/Alaskan (21.5%, a difference of 0.54%), and Alaska Native (21.8%, a difference of 0.58%). Similarly, the demographic groups most similar to Immigrants from Caribbean are Immigrants from Ecuador (20.9%, a difference of 0.11%), Senegalese (21.0%, a difference of 0.38%), Aleut (21.2%, a difference of 1.2%), Immigrants from Senegal (21.2%, a difference of 1.4%), and Ecuadorian (20.5%, a difference of 1.7%).
| Demographics | Rating | Rank | Unemployment Among Ages 16 to 19 years |
| Alsatians | 0.0 /100 | #297 | Tragic 20.5% |
| Haitians | 0.0 /100 | #298 | Tragic 20.5% |
| Immigrants | Uzbekistan | 0.0 /100 | #299 | Tragic 20.5% |
| Ecuadorians | 0.0 /100 | #300 | Tragic 20.5% |
| Immigrants | Ecuador | 0.0 /100 | #301 | Tragic 20.9% |
| Immigrants | Caribbean | 0.0 /100 | #302 | Tragic 20.9% |
| Senegalese | 0.0 /100 | #303 | Tragic 21.0% |
| Aleuts | 0.0 /100 | #304 | Tragic 21.2% |
| Immigrants | Senegal | 0.0 /100 | #305 | Tragic 21.2% |
| U.S. Virgin Islanders | 0.0 /100 | #306 | Tragic 21.3% |
| Blacks/African Americans | 0.0 /100 | #307 | Tragic 21.4% |
| Immigrants | Bangladesh | 0.0 /100 | #308 | Tragic 21.5% |
| Natives/Alaskans | 0.0 /100 | #309 | Tragic 21.5% |
| Vietnamese | 0.0 /100 | #310 | Tragic 21.5% |
| Belizeans | 0.0 /100 | #311 | Tragic 21.6% |
| Houma | 0.0 /100 | #312 | Tragic 21.6% |
| Jamaicans | 0.0 /100 | #313 | Tragic 21.7% |
| Alaska Natives | 0.0 /100 | #314 | Tragic 21.8% |
| Immigrants | Dominica | 0.0 /100 | #315 | Tragic 21.9% |
| Tohono O'odham | 0.0 /100 | #316 | Tragic 22.1% |
| Immigrants | Belize | 0.0 /100 | #317 | Tragic 22.2% |