Houma vs Immigrants from Caribbean 1st Grade
COMPARE
Houma
Immigrants from Caribbean
1st Grade
1st Grade Comparison
Houma
Immigrants from Caribbean
97.2%
1ST GRADE
0.0/ 100
METRIC RATING
291st/ 347
METRIC RANK
97.0%
1ST GRADE
0.0/ 100
METRIC RATING
302nd/ 347
METRIC RANK
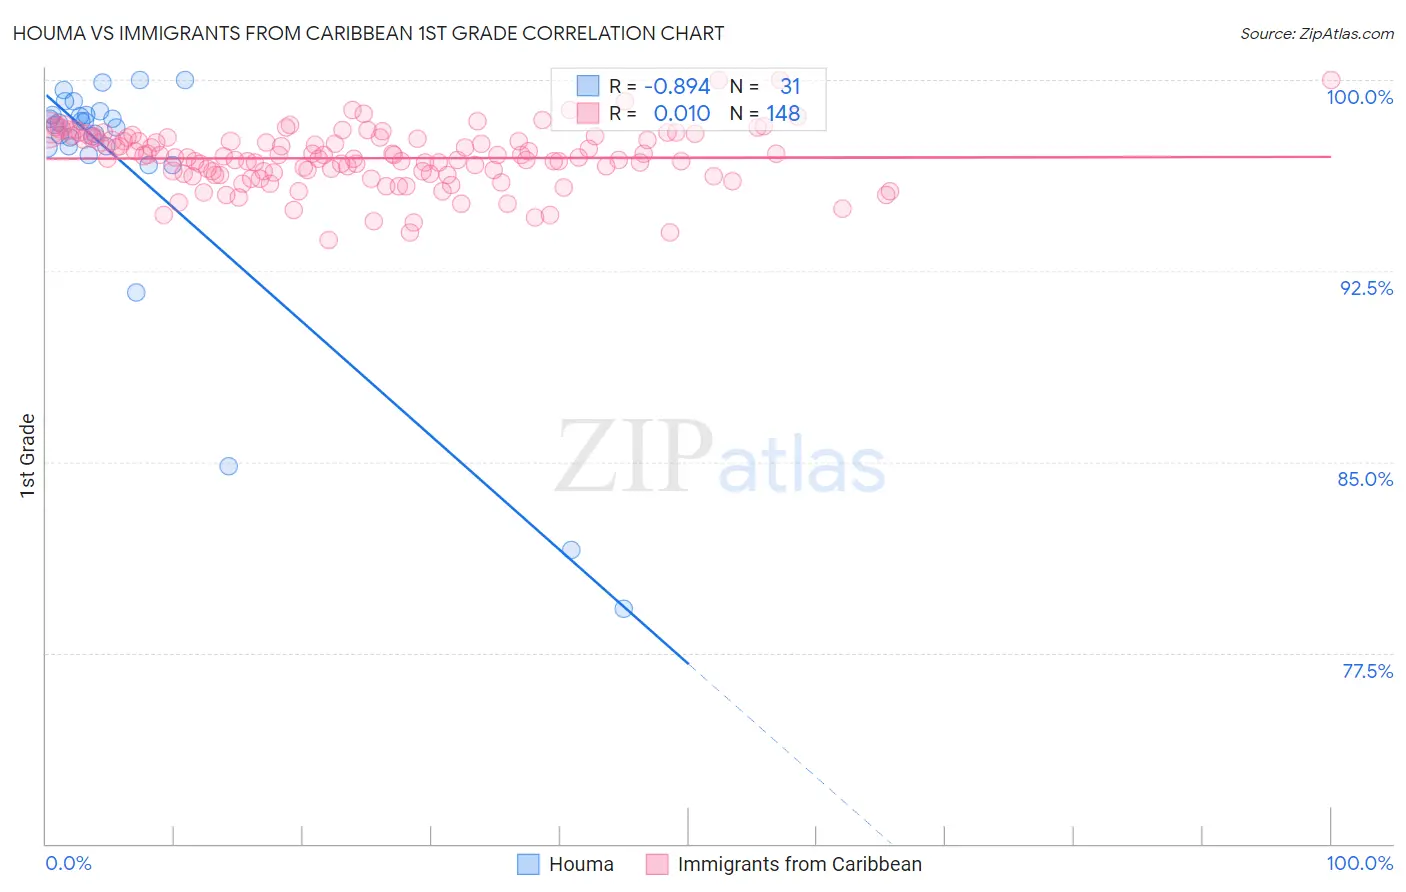
Houma vs Immigrants from Caribbean 1st Grade Correlation Chart
The statistical analysis conducted on geographies consisting of 36,795,916 people shows a very strong negative correlation between the proportion of Houma and percentage of population with at least 1st grade education in the United States with a correlation coefficient (R) of -0.894 and weighted average of 97.2%. Similarly, the statistical analysis conducted on geographies consisting of 449,948,226 people shows no correlation between the proportion of Immigrants from Caribbean and percentage of population with at least 1st grade education in the United States with a correlation coefficient (R) of 0.010 and weighted average of 97.0%, a difference of 0.20%.
1st Grade Correlation Summary
| Measurement | Houma | Immigrants from Caribbean |
| Minimum | 79.2% | 93.7% |
| Maximum | 100.0% | 100.0% |
| Range | 20.8% | 6.3% |
| Mean | 96.5% | 96.9% |
| Median | 98.2% | 97.0% |
| Interquartile 25% (IQ1) | 97.4% | 96.3% |
| Interquartile 75% (IQ3) | 98.6% | 97.7% |
| Interquartile Range (IQR) | 1.2% | 1.4% |
| Standard Deviation (Sample) | 5.1% | 1.1% |
| Standard Deviation (Population) | 5.1% | 1.1% |
Demographics Similar to Houma and Immigrants from Caribbean by 1st Grade
In terms of 1st grade, the demographic groups most similar to Houma are Immigrants from Afghanistan (97.3%, a difference of 0.020%), Immigrants from St. Vincent and the Grenadines (97.3%, a difference of 0.020%), British West Indian (97.2%, a difference of 0.020%), Immigrants from Hong Kong (97.3%, a difference of 0.040%), and Immigrants from Thailand (97.3%, a difference of 0.040%). Similarly, the demographic groups most similar to Immigrants from Caribbean are Immigrants from South Eastern Asia (97.1%, a difference of 0.020%), Somali (97.0%, a difference of 0.030%), Haitian (97.1%, a difference of 0.050%), Nicaraguan (97.0%, a difference of 0.050%), and Ecuadorian (97.0%, a difference of 0.050%).
| Demographics | Rating | Rank | 1st Grade |
| Immigrants | Barbados | 0.0 /100 | #286 | Tragic 97.3% |
| Immigrants | Hong Kong | 0.0 /100 | #287 | Tragic 97.3% |
| Immigrants | Thailand | 0.0 /100 | #288 | Tragic 97.3% |
| Immigrants | Afghanistan | 0.0 /100 | #289 | Tragic 97.3% |
| Immigrants | St. Vincent and the Grenadines | 0.0 /100 | #290 | Tragic 97.3% |
| Houma | 0.0 /100 | #291 | Tragic 97.2% |
| British West Indians | 0.0 /100 | #292 | Tragic 97.2% |
| Malaysians | 0.0 /100 | #293 | Tragic 97.2% |
| Immigrants | Grenada | 0.0 /100 | #294 | Tragic 97.2% |
| Immigrants | Immigrants | 0.0 /100 | #295 | Tragic 97.2% |
| Immigrants | Eritrea | 0.0 /100 | #296 | Tragic 97.2% |
| Central American Indians | 0.0 /100 | #297 | Tragic 97.1% |
| Immigrants | Dominica | 0.0 /100 | #298 | Tragic 97.1% |
| Immigrants | Cuba | 0.0 /100 | #299 | Tragic 97.1% |
| Haitians | 0.0 /100 | #300 | Tragic 97.1% |
| Immigrants | South Eastern Asia | 0.0 /100 | #301 | Tragic 97.1% |
| Immigrants | Caribbean | 0.0 /100 | #302 | Tragic 97.0% |
| Somalis | 0.0 /100 | #303 | Tragic 97.0% |
| Nicaraguans | 0.0 /100 | #304 | Tragic 97.0% |
| Ecuadorians | 0.0 /100 | #305 | Tragic 97.0% |
| Belizeans | 0.0 /100 | #306 | Tragic 96.9% |