Houma vs Immigrants from Caribbean Unemployment Among Seniors over 65 years
COMPARE
Houma
Immigrants from Caribbean
Unemployment Among Seniors over 65 years
Unemployment Among Seniors over 65 years Comparison
Houma
Immigrants from Caribbean
4.8%
UNEMPLOYMENT AMONG SENIORS OVER 65 YEARS
100.0/ 100
METRIC RATING
27th/ 347
METRIC RANK
5.3%
UNEMPLOYMENT AMONG SENIORS OVER 65 YEARS
0.7/ 100
METRIC RATING
247th/ 347
METRIC RANK
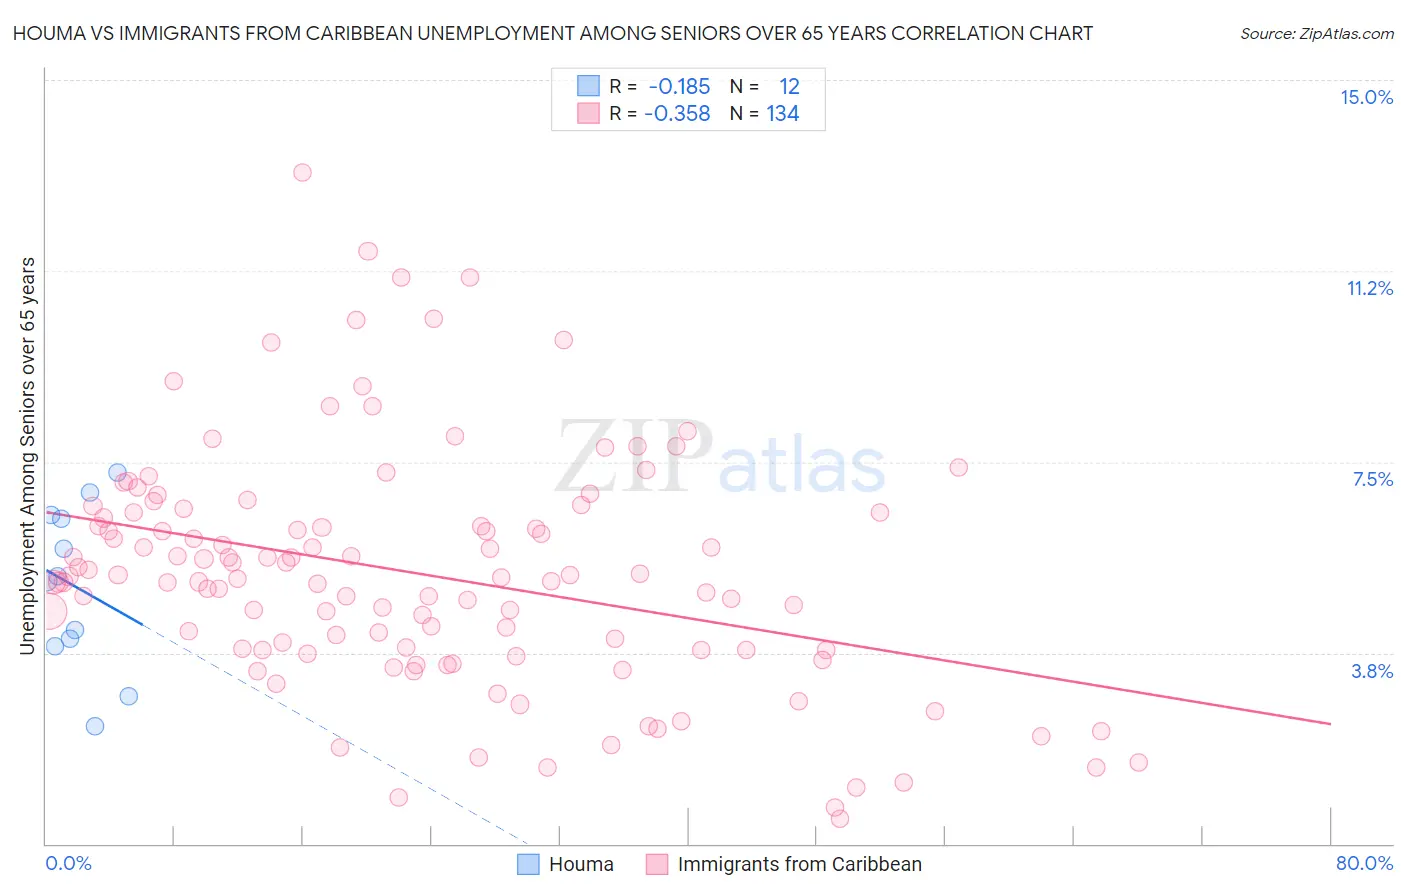
Houma vs Immigrants from Caribbean Unemployment Among Seniors over 65 years Correlation Chart
The statistical analysis conducted on geographies consisting of 35,538,333 people shows a poor negative correlation between the proportion of Houma and unemployment rate amomg seniors over the age of 65 in the United States with a correlation coefficient (R) of -0.185 and weighted average of 4.8%. Similarly, the statistical analysis conducted on geographies consisting of 398,914,633 people shows a mild negative correlation between the proportion of Immigrants from Caribbean and unemployment rate amomg seniors over the age of 65 in the United States with a correlation coefficient (R) of -0.358 and weighted average of 5.3%, a difference of 12.2%.
Unemployment Among Seniors over 65 years Correlation Summary
| Measurement | Houma | Immigrants from Caribbean |
| Minimum | 2.3% | 0.50% |
| Maximum | 7.3% | 13.2% |
| Range | 5.0% | 12.7% |
| Mean | 5.0% | 5.3% |
| Median | 5.2% | 5.2% |
| Interquartile 25% (IQ1) | 4.0% | 3.8% |
| Interquartile 75% (IQ3) | 6.4% | 6.5% |
| Interquartile Range (IQR) | 2.5% | 2.7% |
| Standard Deviation (Sample) | 1.6% | 2.3% |
| Standard Deviation (Population) | 1.5% | 2.3% |
Similar Demographics by Unemployment Among Seniors over 65 years
Demographics Similar to Houma by Unemployment Among Seniors over 65 years
In terms of unemployment among seniors over 65 years, the demographic groups most similar to Houma are Immigrants from Lebanon (4.8%, a difference of 0.070%), Ugandan (4.8%, a difference of 0.080%), Immigrants from North Macedonia (4.8%, a difference of 0.17%), Tongan (4.7%, a difference of 0.45%), and Belgian (4.8%, a difference of 0.57%).
| Demographics | Rating | Rank | Unemployment Among Seniors over 65 years |
| Immigrants | Nepal | 100.0 /100 | #20 | Exceptional 4.7% |
| Norwegians | 100.0 /100 | #21 | Exceptional 4.7% |
| Czechs | 100.0 /100 | #22 | Exceptional 4.7% |
| Kenyans | 100.0 /100 | #23 | Exceptional 4.7% |
| Iraqis | 100.0 /100 | #24 | Exceptional 4.7% |
| Tongans | 100.0 /100 | #25 | Exceptional 4.7% |
| Immigrants | Lebanon | 100.0 /100 | #26 | Exceptional 4.8% |
| Houma | 100.0 /100 | #27 | Exceptional 4.8% |
| Ugandans | 100.0 /100 | #28 | Exceptional 4.8% |
| Immigrants | North Macedonia | 100.0 /100 | #29 | Exceptional 4.8% |
| Belgians | 100.0 /100 | #30 | Exceptional 4.8% |
| Immigrants | Uganda | 100.0 /100 | #31 | Exceptional 4.8% |
| Slovenes | 100.0 /100 | #32 | Exceptional 4.8% |
| Palestinians | 100.0 /100 | #33 | Exceptional 4.8% |
| Bhutanese | 100.0 /100 | #34 | Exceptional 4.8% |
Demographics Similar to Immigrants from Caribbean by Unemployment Among Seniors over 65 years
In terms of unemployment among seniors over 65 years, the demographic groups most similar to Immigrants from Caribbean are Colombian (5.3%, a difference of 0.040%), French Canadian (5.4%, a difference of 0.050%), Ottawa (5.3%, a difference of 0.070%), Peruvian (5.3%, a difference of 0.080%), and Immigrants (5.4%, a difference of 0.080%).
| Demographics | Rating | Rank | Unemployment Among Seniors over 65 years |
| Immigrants | Trinidad and Tobago | 1.6 /100 | #240 | Tragic 5.3% |
| Apache | 1.3 /100 | #241 | Tragic 5.3% |
| Bahamians | 0.9 /100 | #242 | Tragic 5.3% |
| Nigerians | 0.9 /100 | #243 | Tragic 5.3% |
| Peruvians | 0.8 /100 | #244 | Tragic 5.3% |
| Ottawa | 0.8 /100 | #245 | Tragic 5.3% |
| Colombians | 0.7 /100 | #246 | Tragic 5.3% |
| Immigrants | Caribbean | 0.7 /100 | #247 | Tragic 5.3% |
| French Canadians | 0.7 /100 | #248 | Tragic 5.4% |
| Immigrants | Immigrants | 0.6 /100 | #249 | Tragic 5.4% |
| Ghanaians | 0.6 /100 | #250 | Tragic 5.4% |
| West Indians | 0.6 /100 | #251 | Tragic 5.4% |
| Trinidadians and Tobagonians | 0.6 /100 | #252 | Tragic 5.4% |
| Immigrants | Sierra Leone | 0.6 /100 | #253 | Tragic 5.4% |
| Paraguayans | 0.5 /100 | #254 | Tragic 5.4% |