Immigrants from Turkey vs Immigrants from Bahamas Average Family Size
COMPARE
Immigrants from Turkey
Immigrants from Bahamas
Average Family Size
Average Family Size Comparison
Immigrants from Turkey
Immigrants from Bahamas
3.18
AVERAGE FAMILY SIZE
4.2/ 100
METRIC RATING
235th/ 347
METRIC RANK
3.27
AVERAGE FAMILY SIZE
93.6/ 100
METRIC RATING
120th/ 347
METRIC RANK
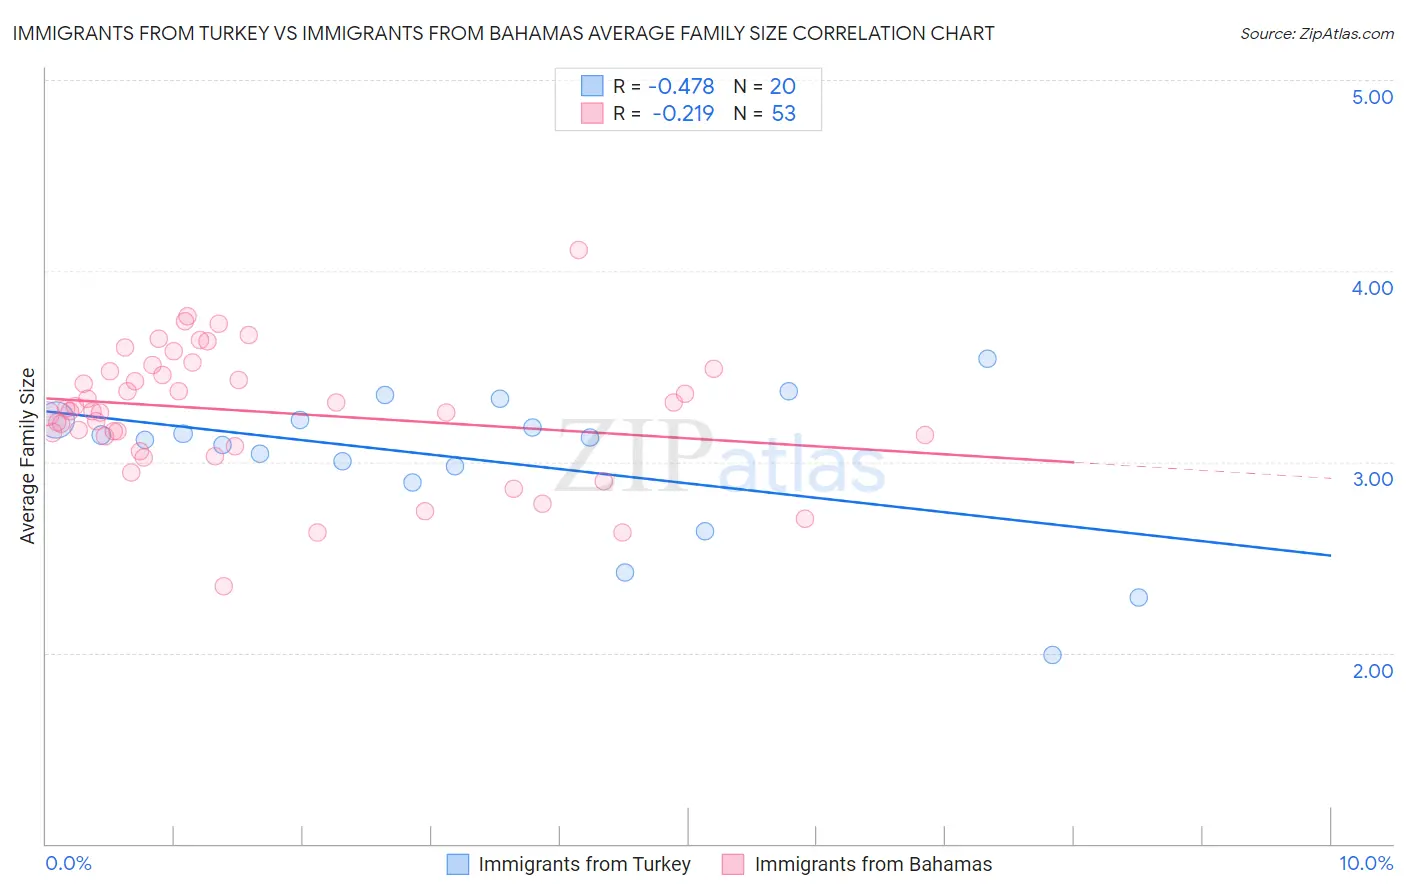
Immigrants from Turkey vs Immigrants from Bahamas Average Family Size Correlation Chart
The statistical analysis conducted on geographies consisting of 222,976,596 people shows a moderate negative correlation between the proportion of Immigrants from Turkey and average family size in the United States with a correlation coefficient (R) of -0.478 and weighted average of 3.18. Similarly, the statistical analysis conducted on geographies consisting of 104,605,008 people shows a weak negative correlation between the proportion of Immigrants from Bahamas and average family size in the United States with a correlation coefficient (R) of -0.219 and weighted average of 3.27, a difference of 2.7%.
Average Family Size Correlation Summary
| Measurement | Immigrants from Turkey | Immigrants from Bahamas |
| Minimum | 1.99 | 2.35 |
| Maximum | 3.54 | 4.11 |
| Range | 1.55 | 1.76 |
| Mean | 3.00 | 3.26 |
| Median | 3.12 | 3.27 |
| Interquartile 25% (IQ1) | 2.93 | 3.11 |
| Interquartile 75% (IQ3) | 3.22 | 3.48 |
| Interquartile Range (IQR) | 0.28 | 0.38 |
| Standard Deviation (Sample) | 0.39 | 0.33 |
| Standard Deviation (Population) | 0.38 | 0.33 |
Similar Demographics by Average Family Size
Demographics Similar to Immigrants from Turkey by Average Family Size
In terms of average family size, the demographic groups most similar to Immigrants from Turkey are Immigrants from Portugal (3.18, a difference of 0.010%), Iranian (3.18, a difference of 0.020%), Brazilian (3.18, a difference of 0.030%), Cherokee (3.18, a difference of 0.050%), and Immigrants from Romania (3.18, a difference of 0.060%).
| Demographics | Rating | Rank | Average Family Size |
| Immigrants | Nonimmigrants | 5.7 /100 | #228 | Tragic 3.19 |
| Immigrants | Italy | 5.3 /100 | #229 | Tragic 3.19 |
| Icelanders | 5.2 /100 | #230 | Tragic 3.19 |
| Basques | 5.2 /100 | #231 | Tragic 3.19 |
| Cherokee | 4.7 /100 | #232 | Tragic 3.18 |
| Brazilians | 4.5 /100 | #233 | Tragic 3.18 |
| Iranians | 4.5 /100 | #234 | Tragic 3.18 |
| Immigrants | Turkey | 4.2 /100 | #235 | Tragic 3.18 |
| Immigrants | Portugal | 4.2 /100 | #236 | Tragic 3.18 |
| Immigrants | Romania | 3.7 /100 | #237 | Tragic 3.18 |
| Romanians | 3.7 /100 | #238 | Tragic 3.18 |
| Houma | 3.4 /100 | #239 | Tragic 3.18 |
| Osage | 3.2 /100 | #240 | Tragic 3.18 |
| Immigrants | Japan | 3.0 /100 | #241 | Tragic 3.18 |
| Hungarians | 3.0 /100 | #242 | Tragic 3.18 |
Demographics Similar to Immigrants from Bahamas by Average Family Size
In terms of average family size, the demographic groups most similar to Immigrants from Bahamas are Immigrants from Indonesia (3.27, a difference of 0.010%), Immigrants from Thailand (3.27, a difference of 0.020%), Immigrants from Asia (3.27, a difference of 0.030%), Immigrants from Colombia (3.27, a difference of 0.060%), and Alaskan Athabascan (3.27, a difference of 0.080%).
| Demographics | Rating | Rank | Average Family Size |
| Immigrants | Panama | 95.6 /100 | #113 | Exceptional 3.27 |
| South Americans | 95.1 /100 | #114 | Exceptional 3.27 |
| Immigrants | Liberia | 95.0 /100 | #115 | Exceptional 3.27 |
| Immigrants | South America | 95.0 /100 | #116 | Exceptional 3.27 |
| Kiowa | 94.8 /100 | #117 | Exceptional 3.27 |
| Immigrants | Asia | 94.0 /100 | #118 | Exceptional 3.27 |
| Immigrants | Indonesia | 93.7 /100 | #119 | Exceptional 3.27 |
| Immigrants | Bahamas | 93.6 /100 | #120 | Exceptional 3.27 |
| Immigrants | Thailand | 93.3 /100 | #121 | Exceptional 3.27 |
| Immigrants | Colombia | 92.8 /100 | #122 | Exceptional 3.27 |
| Alaskan Athabascans | 92.4 /100 | #123 | Exceptional 3.27 |
| South American Indians | 91.6 /100 | #124 | Exceptional 3.26 |
| Immigrants | Cuba | 91.3 /100 | #125 | Exceptional 3.26 |
| Immigrants | Costa Rica | 90.7 /100 | #126 | Exceptional 3.26 |
| Immigrants | Syria | 90.6 /100 | #127 | Exceptional 3.26 |