Honduran vs Immigrants from Zimbabwe 7th Grade
COMPARE
Honduran
Immigrants from Zimbabwe
7th Grade
7th Grade Comparison
Hondurans
Immigrants from Zimbabwe
92.9%
7TH GRADE
0.0/ 100
METRIC RATING
331st/ 347
METRIC RANK
96.5%
7TH GRADE
96.6/ 100
METRIC RATING
114th/ 347
METRIC RANK
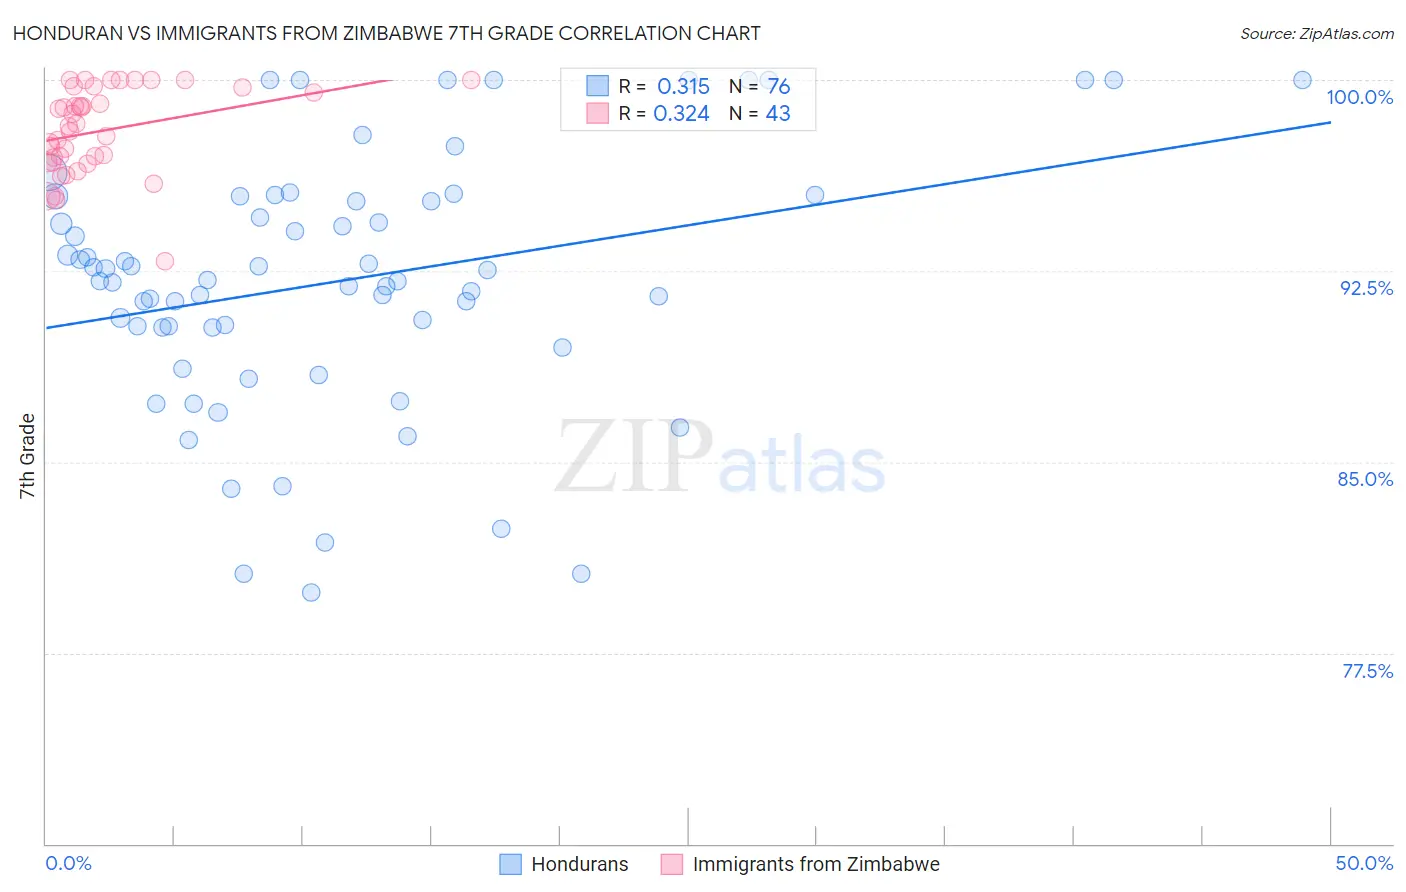
Honduran vs Immigrants from Zimbabwe 7th Grade Correlation Chart
The statistical analysis conducted on geographies consisting of 357,784,803 people shows a mild positive correlation between the proportion of Hondurans and percentage of population with at least 7th grade education in the United States with a correlation coefficient (R) of 0.315 and weighted average of 92.9%. Similarly, the statistical analysis conducted on geographies consisting of 117,756,150 people shows a mild positive correlation between the proportion of Immigrants from Zimbabwe and percentage of population with at least 7th grade education in the United States with a correlation coefficient (R) of 0.324 and weighted average of 96.5%, a difference of 4.0%.
7th Grade Correlation Summary
| Measurement | Honduran | Immigrants from Zimbabwe |
| Minimum | 79.9% | 92.9% |
| Maximum | 100.0% | 100.0% |
| Range | 20.1% | 7.1% |
| Mean | 92.1% | 98.0% |
| Median | 92.1% | 98.2% |
| Interquartile 25% (IQ1) | 90.3% | 96.8% |
| Interquartile 75% (IQ3) | 95.3% | 99.7% |
| Interquartile Range (IQR) | 5.1% | 2.9% |
| Standard Deviation (Sample) | 5.0% | 1.7% |
| Standard Deviation (Population) | 4.9% | 1.7% |
Similar Demographics by 7th Grade
Demographics Similar to Hondurans by 7th Grade
In terms of 7th grade, the demographic groups most similar to Hondurans are Immigrants from Dominican Republic (92.9%, a difference of 0.040%), Immigrants from the Azores (93.0%, a difference of 0.090%), Immigrants from Nicaragua (93.0%, a difference of 0.13%), Hispanic or Latino (92.7%, a difference of 0.14%), and Immigrants from Armenia (92.7%, a difference of 0.16%).
| Demographics | Rating | Rank | 7th Grade |
| Dominicans | 0.0 /100 | #324 | Tragic 93.3% |
| Central American Indians | 0.0 /100 | #325 | Tragic 93.3% |
| Nepalese | 0.0 /100 | #326 | Tragic 93.2% |
| Immigrants | Cabo Verde | 0.0 /100 | #327 | Tragic 93.1% |
| Immigrants | Nicaragua | 0.0 /100 | #328 | Tragic 93.0% |
| Immigrants | Azores | 0.0 /100 | #329 | Tragic 93.0% |
| Immigrants | Dominican Republic | 0.0 /100 | #330 | Tragic 92.9% |
| Hondurans | 0.0 /100 | #331 | Tragic 92.9% |
| Hispanics or Latinos | 0.0 /100 | #332 | Tragic 92.7% |
| Immigrants | Armenia | 0.0 /100 | #333 | Tragic 92.7% |
| Immigrants | Yemen | 0.0 /100 | #334 | Tragic 92.6% |
| Mexican American Indians | 0.0 /100 | #335 | Tragic 92.6% |
| Immigrants | Honduras | 0.0 /100 | #336 | Tragic 92.5% |
| Immigrants | Latin America | 0.0 /100 | #337 | Tragic 92.2% |
| Central Americans | 0.0 /100 | #338 | Tragic 92.1% |
Demographics Similar to Immigrants from Zimbabwe by 7th Grade
In terms of 7th grade, the demographic groups most similar to Immigrants from Zimbabwe are Choctaw (96.5%, a difference of 0.0%), Syrian (96.5%, a difference of 0.0%), Pueblo (96.5%, a difference of 0.010%), Nonimmigrants (96.5%, a difference of 0.020%), and Okinawan (96.6%, a difference of 0.040%).
| Demographics | Rating | Rank | 7th Grade |
| Lumbee | 97.8 /100 | #107 | Exceptional 96.6% |
| Immigrants | Saudi Arabia | 97.8 /100 | #108 | Exceptional 96.6% |
| Bhutanese | 97.7 /100 | #109 | Exceptional 96.6% |
| Okinawans | 97.4 /100 | #110 | Exceptional 96.6% |
| Immigrants | Latvia | 97.4 /100 | #111 | Exceptional 96.6% |
| Immigrants | Nonimmigrants | 97.0 /100 | #112 | Exceptional 96.5% |
| Pueblo | 96.8 /100 | #113 | Exceptional 96.5% |
| Immigrants | Zimbabwe | 96.6 /100 | #114 | Exceptional 96.5% |
| Choctaw | 96.6 /100 | #115 | Exceptional 96.5% |
| Syrians | 96.6 /100 | #116 | Exceptional 96.5% |
| Immigrants | Moldova | 95.7 /100 | #117 | Exceptional 96.5% |
| Immigrants | Japan | 95.5 /100 | #118 | Exceptional 96.5% |
| Immigrants | Norway | 95.2 /100 | #119 | Exceptional 96.5% |
| Immigrants | Croatia | 95.0 /100 | #120 | Exceptional 96.5% |
| Cheyenne | 94.9 /100 | #121 | Exceptional 96.5% |