Honduran vs Welsh Single Mother Households
COMPARE
Honduran
Welsh
Single Mother Households
Single Mother Households Comparison
Hondurans
Welsh
8.1%
SINGLE MOTHER HOUSEHOLDS
0.0/ 100
METRIC RATING
310th/ 347
METRIC RANK
5.9%
SINGLE MOTHER HOUSEHOLDS
92.8/ 100
METRIC RATING
126th/ 347
METRIC RANK
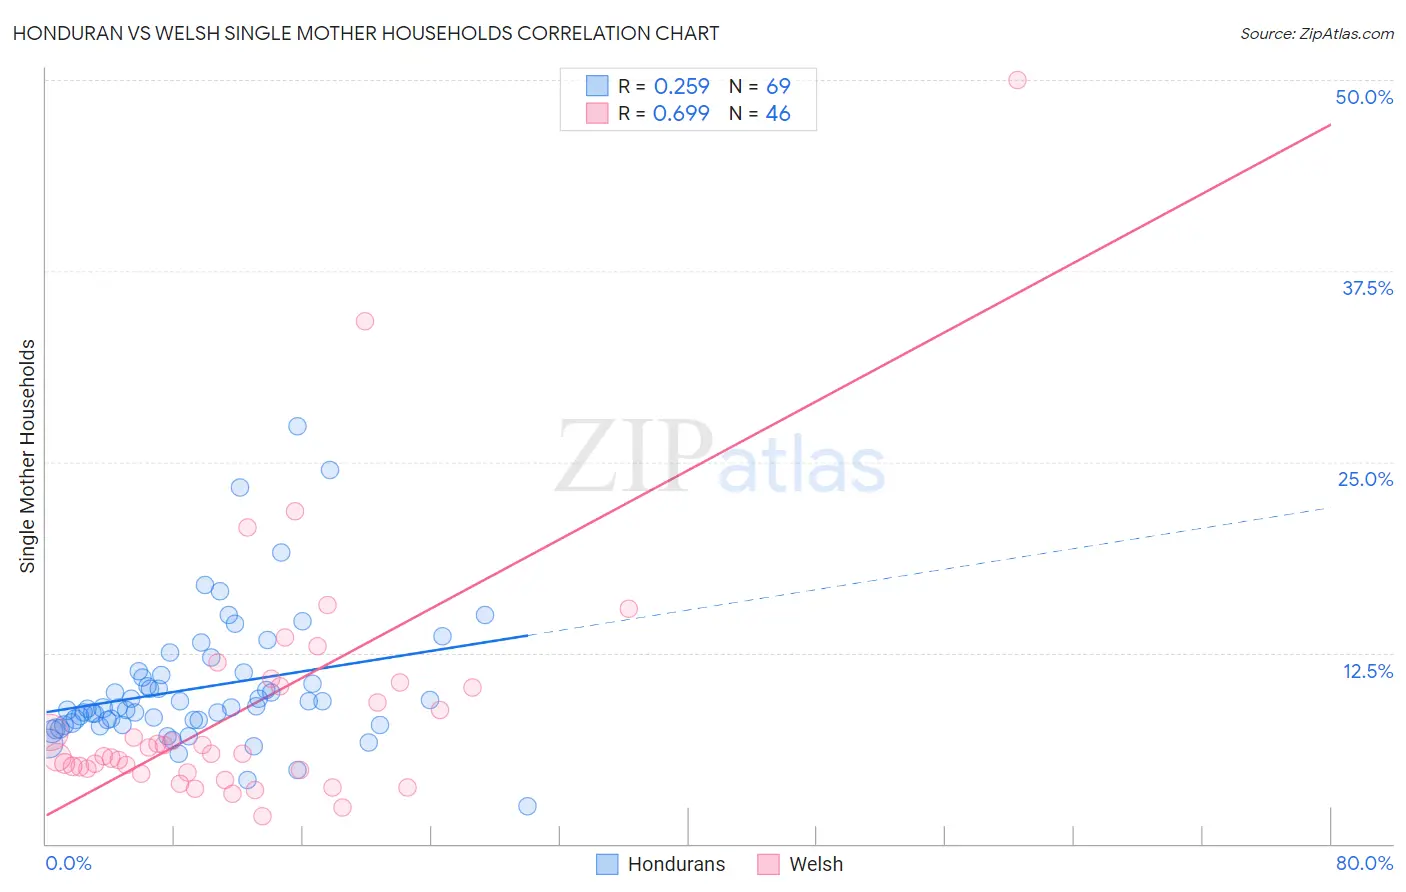
Honduran vs Welsh Single Mother Households Correlation Chart
The statistical analysis conducted on geographies consisting of 357,144,636 people shows a weak positive correlation between the proportion of Hondurans and percentage of single mother households in the United States with a correlation coefficient (R) of 0.259 and weighted average of 8.1%. Similarly, the statistical analysis conducted on geographies consisting of 524,967,910 people shows a significant positive correlation between the proportion of Welsh and percentage of single mother households in the United States with a correlation coefficient (R) of 0.699 and weighted average of 5.9%, a difference of 37.9%.
Single Mother Households Correlation Summary
| Measurement | Honduran | Welsh |
| Minimum | 2.5% | 1.8% |
| Maximum | 27.3% | 50.0% |
| Range | 24.8% | 48.2% |
| Mean | 10.2% | 9.0% |
| Median | 8.9% | 5.9% |
| Interquartile 25% (IQ1) | 7.9% | 4.8% |
| Interquartile 75% (IQ3) | 11.1% | 10.3% |
| Interquartile Range (IQR) | 3.2% | 5.5% |
| Standard Deviation (Sample) | 4.4% | 8.6% |
| Standard Deviation (Population) | 4.3% | 8.5% |
Similar Demographics by Single Mother Households
Demographics Similar to Hondurans by Single Mother Households
In terms of single mother households, the demographic groups most similar to Hondurans are Cheyenne (8.1%, a difference of 0.050%), Immigrants from Congo (8.1%, a difference of 0.29%), Immigrants from Central America (8.1%, a difference of 0.50%), Immigrants from St. Vincent and the Grenadines (8.0%, a difference of 0.51%), and Bangladeshi (8.1%, a difference of 0.59%).
| Demographics | Rating | Rank | Single Mother Households |
| Immigrants | Bahamas | 0.0 /100 | #303 | Tragic 8.0% |
| Natives/Alaskans | 0.0 /100 | #304 | Tragic 8.0% |
| Colville | 0.0 /100 | #305 | Tragic 8.0% |
| Immigrants | Barbados | 0.0 /100 | #306 | Tragic 8.0% |
| Immigrants | St. Vincent and the Grenadines | 0.0 /100 | #307 | Tragic 8.0% |
| Immigrants | Central America | 0.0 /100 | #308 | Tragic 8.1% |
| Cheyenne | 0.0 /100 | #309 | Tragic 8.1% |
| Hondurans | 0.0 /100 | #310 | Tragic 8.1% |
| Immigrants | Congo | 0.0 /100 | #311 | Tragic 8.1% |
| Bangladeshis | 0.0 /100 | #312 | Tragic 8.1% |
| Immigrants | Grenada | 0.0 /100 | #313 | Tragic 8.2% |
| Immigrants | Mexico | 0.0 /100 | #314 | Tragic 8.2% |
| Immigrants | Western Africa | 0.0 /100 | #315 | Tragic 8.2% |
| Africans | 0.0 /100 | #316 | Tragic 8.2% |
| Immigrants | Honduras | 0.0 /100 | #317 | Tragic 8.2% |
Demographics Similar to Welsh by Single Mother Households
In terms of single mother households, the demographic groups most similar to Welsh are Slavic (5.9%, a difference of 0.020%), Immigrants from Argentina (5.9%, a difference of 0.18%), Lebanese (5.9%, a difference of 0.19%), Immigrants from Uzbekistan (5.9%, a difference of 0.25%), and Czechoslovakian (5.9%, a difference of 0.27%).
| Demographics | Rating | Rank | Single Mother Households |
| South Africans | 94.1 /100 | #119 | Exceptional 5.8% |
| Tongans | 93.7 /100 | #120 | Exceptional 5.8% |
| Argentineans | 93.7 /100 | #121 | Exceptional 5.8% |
| Belgians | 93.5 /100 | #122 | Exceptional 5.8% |
| Immigrants | Uzbekistan | 93.4 /100 | #123 | Exceptional 5.9% |
| Immigrants | Argentina | 93.2 /100 | #124 | Exceptional 5.9% |
| Slavs | 92.9 /100 | #125 | Exceptional 5.9% |
| Welsh | 92.8 /100 | #126 | Exceptional 5.9% |
| Lebanese | 92.4 /100 | #127 | Exceptional 5.9% |
| Czechoslovakians | 92.2 /100 | #128 | Exceptional 5.9% |
| Immigrants | Bolivia | 92.2 /100 | #129 | Exceptional 5.9% |
| Palestinians | 92.1 /100 | #130 | Exceptional 5.9% |
| Immigrants | Spain | 91.2 /100 | #131 | Exceptional 5.9% |
| Albanians | 91.1 /100 | #132 | Exceptional 5.9% |
| Egyptians | 90.7 /100 | #133 | Exceptional 5.9% |