Honduran vs Immigrants from Belgium Single Mother Households
COMPARE
Honduran
Immigrants from Belgium
Single Mother Households
Single Mother Households Comparison
Hondurans
Immigrants from Belgium
8.1%
SINGLE MOTHER HOUSEHOLDS
0.0/ 100
METRIC RATING
310th/ 347
METRIC RANK
5.3%
SINGLE MOTHER HOUSEHOLDS
99.7/ 100
METRIC RATING
37th/ 347
METRIC RANK
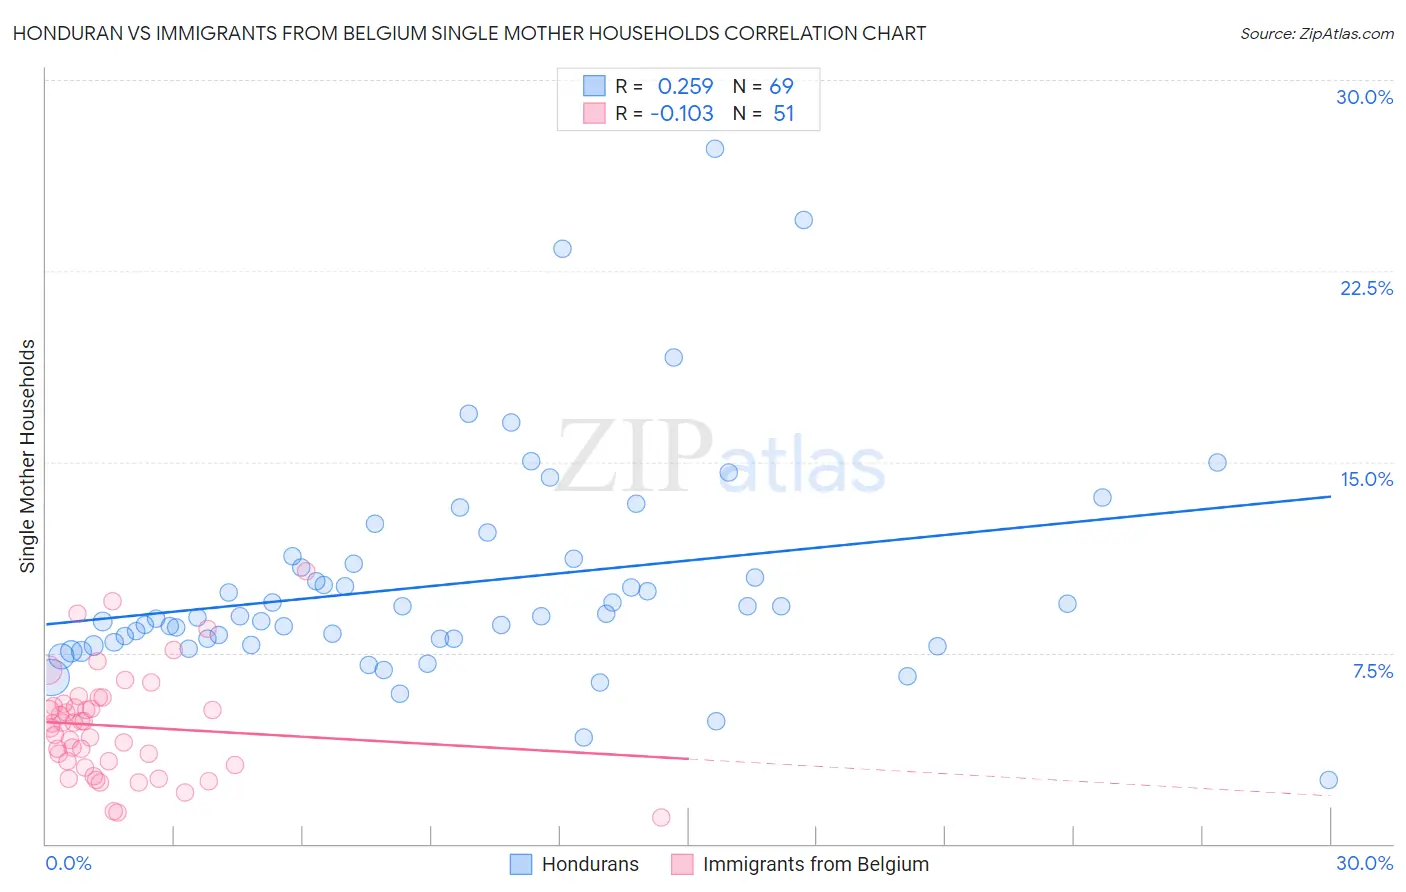
Honduran vs Immigrants from Belgium Single Mother Households Correlation Chart
The statistical analysis conducted on geographies consisting of 357,144,636 people shows a weak positive correlation between the proportion of Hondurans and percentage of single mother households in the United States with a correlation coefficient (R) of 0.259 and weighted average of 8.1%. Similarly, the statistical analysis conducted on geographies consisting of 146,477,157 people shows a poor negative correlation between the proportion of Immigrants from Belgium and percentage of single mother households in the United States with a correlation coefficient (R) of -0.103 and weighted average of 5.3%, a difference of 51.8%.
Single Mother Households Correlation Summary
| Measurement | Honduran | Immigrants from Belgium |
| Minimum | 2.5% | 1.1% |
| Maximum | 27.3% | 10.7% |
| Range | 24.8% | 9.7% |
| Mean | 10.2% | 4.6% |
| Median | 8.9% | 4.7% |
| Interquartile 25% (IQ1) | 7.9% | 3.1% |
| Interquartile 75% (IQ3) | 11.1% | 5.5% |
| Interquartile Range (IQR) | 3.2% | 2.4% |
| Standard Deviation (Sample) | 4.4% | 2.1% |
| Standard Deviation (Population) | 4.3% | 2.1% |
Similar Demographics by Single Mother Households
Demographics Similar to Hondurans by Single Mother Households
In terms of single mother households, the demographic groups most similar to Hondurans are Cheyenne (8.1%, a difference of 0.050%), Immigrants from Congo (8.1%, a difference of 0.29%), Immigrants from Central America (8.1%, a difference of 0.50%), Immigrants from St. Vincent and the Grenadines (8.0%, a difference of 0.51%), and Bangladeshi (8.1%, a difference of 0.59%).
| Demographics | Rating | Rank | Single Mother Households |
| Immigrants | Bahamas | 0.0 /100 | #303 | Tragic 8.0% |
| Natives/Alaskans | 0.0 /100 | #304 | Tragic 8.0% |
| Colville | 0.0 /100 | #305 | Tragic 8.0% |
| Immigrants | Barbados | 0.0 /100 | #306 | Tragic 8.0% |
| Immigrants | St. Vincent and the Grenadines | 0.0 /100 | #307 | Tragic 8.0% |
| Immigrants | Central America | 0.0 /100 | #308 | Tragic 8.1% |
| Cheyenne | 0.0 /100 | #309 | Tragic 8.1% |
| Hondurans | 0.0 /100 | #310 | Tragic 8.1% |
| Immigrants | Congo | 0.0 /100 | #311 | Tragic 8.1% |
| Bangladeshis | 0.0 /100 | #312 | Tragic 8.1% |
| Immigrants | Grenada | 0.0 /100 | #313 | Tragic 8.2% |
| Immigrants | Mexico | 0.0 /100 | #314 | Tragic 8.2% |
| Immigrants | Western Africa | 0.0 /100 | #315 | Tragic 8.2% |
| Africans | 0.0 /100 | #316 | Tragic 8.2% |
| Immigrants | Honduras | 0.0 /100 | #317 | Tragic 8.2% |
Demographics Similar to Immigrants from Belgium by Single Mother Households
In terms of single mother households, the demographic groups most similar to Immigrants from Belgium are Immigrants from Czechoslovakia (5.3%, a difference of 0.14%), Immigrants from Northern Europe (5.3%, a difference of 0.35%), Bulgarian (5.3%, a difference of 0.38%), Immigrants from Switzerland (5.3%, a difference of 0.41%), and Immigrants from Serbia (5.4%, a difference of 0.43%).
| Demographics | Rating | Rank | Single Mother Households |
| Burmese | 99.7 /100 | #30 | Exceptional 5.3% |
| Immigrants | Korea | 99.7 /100 | #31 | Exceptional 5.3% |
| Cambodians | 99.7 /100 | #32 | Exceptional 5.3% |
| Immigrants | Switzerland | 99.7 /100 | #33 | Exceptional 5.3% |
| Bulgarians | 99.7 /100 | #34 | Exceptional 5.3% |
| Immigrants | Northern Europe | 99.7 /100 | #35 | Exceptional 5.3% |
| Immigrants | Czechoslovakia | 99.7 /100 | #36 | Exceptional 5.3% |
| Immigrants | Belgium | 99.7 /100 | #37 | Exceptional 5.3% |
| Immigrants | Serbia | 99.6 /100 | #38 | Exceptional 5.4% |
| Immigrants | Sweden | 99.6 /100 | #39 | Exceptional 5.4% |
| Estonians | 99.6 /100 | #40 | Exceptional 5.4% |
| Immigrants | Greece | 99.5 /100 | #41 | Exceptional 5.4% |
| Macedonians | 99.5 /100 | #42 | Exceptional 5.4% |
| Immigrants | South Central Asia | 99.5 /100 | #43 | Exceptional 5.4% |
| Lithuanians | 99.4 /100 | #44 | Exceptional 5.4% |