Honduran vs Immigrants from Kenya In Labor Force | Age 30-34
COMPARE
Honduran
Immigrants from Kenya
In Labor Force | Age 30-34
In Labor Force | Age 30-34 Comparison
Hondurans
Immigrants from Kenya
83.8%
IN LABOR FORCE | AGE 30-34
0.3/ 100
METRIC RATING
258th/ 347
METRIC RANK
85.5%
IN LABOR FORCE | AGE 30-34
99.6/ 100
METRIC RATING
54th/ 347
METRIC RANK
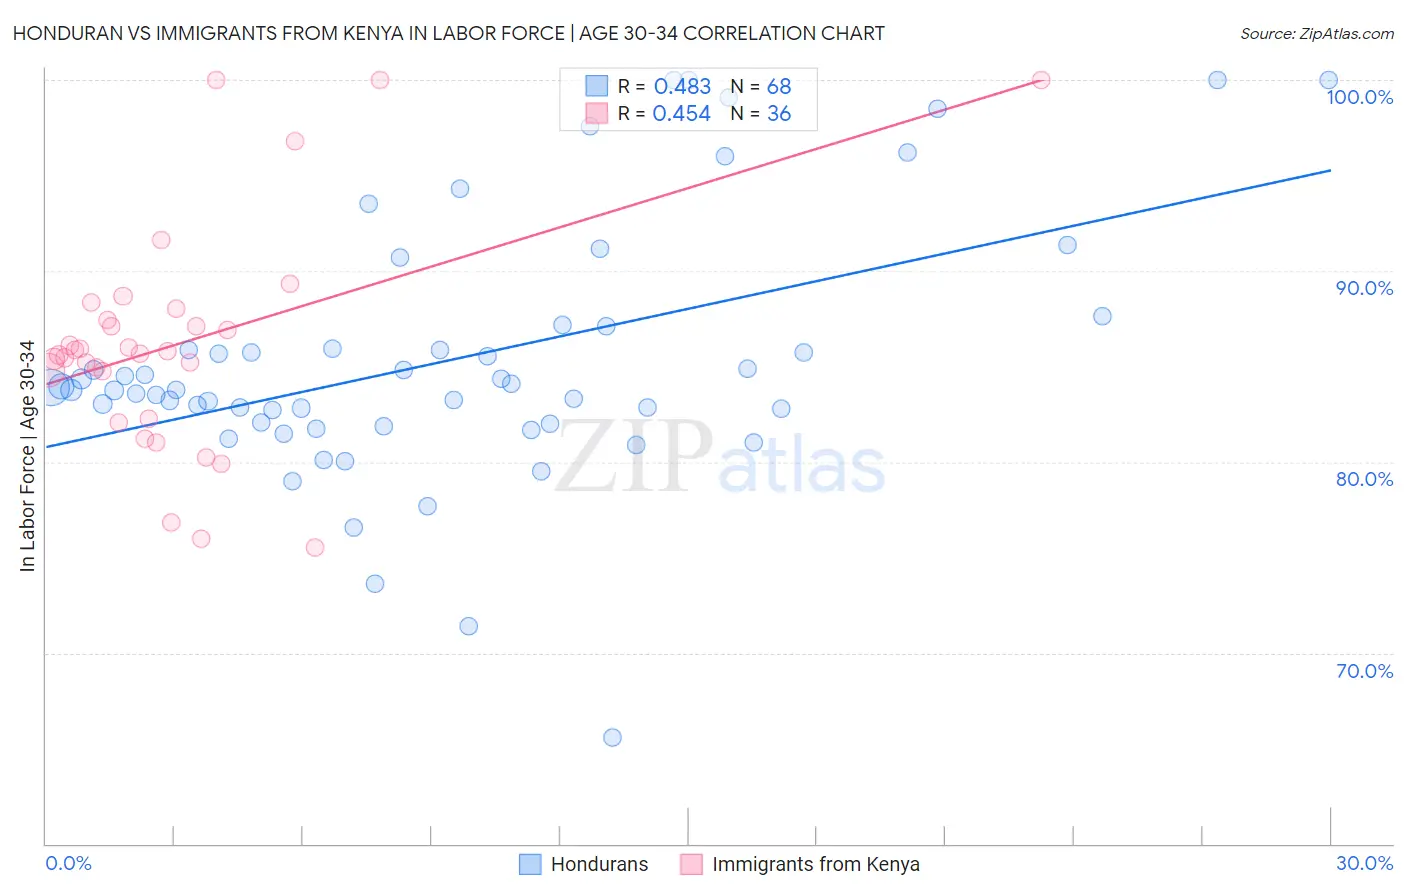
Honduran vs Immigrants from Kenya In Labor Force | Age 30-34 Correlation Chart
The statistical analysis conducted on geographies consisting of 357,599,463 people shows a moderate positive correlation between the proportion of Hondurans and labor force participation rate among population between the ages 30 and 34 in the United States with a correlation coefficient (R) of 0.483 and weighted average of 83.8%. Similarly, the statistical analysis conducted on geographies consisting of 217,993,590 people shows a moderate positive correlation between the proportion of Immigrants from Kenya and labor force participation rate among population between the ages 30 and 34 in the United States with a correlation coefficient (R) of 0.454 and weighted average of 85.5%, a difference of 2.0%.
In Labor Force | Age 30-34 Correlation Summary
| Measurement | Honduran | Immigrants from Kenya |
| Minimum | 65.6% | 75.5% |
| Maximum | 100.0% | 100.0% |
| Range | 34.4% | 24.5% |
| Mean | 85.3% | 86.2% |
| Median | 83.8% | 85.8% |
| Interquartile 25% (IQ1) | 82.0% | 83.5% |
| Interquartile 75% (IQ3) | 86.5% | 87.7% |
| Interquartile Range (IQR) | 4.5% | 4.3% |
| Standard Deviation (Sample) | 6.8% | 5.9% |
| Standard Deviation (Population) | 6.7% | 5.8% |
Similar Demographics by In Labor Force | Age 30-34
Demographics Similar to Hondurans by In Labor Force | Age 30-34
In terms of in labor force | age 30-34, the demographic groups most similar to Hondurans are Scotch-Irish (83.8%, a difference of 0.0%), Immigrants from Dominican Republic (83.8%, a difference of 0.020%), Iraqi (83.8%, a difference of 0.030%), Guyanese (83.8%, a difference of 0.030%), and Immigrants from Lebanon (83.9%, a difference of 0.040%).
| Demographics | Rating | Rank | In Labor Force | Age 30-34 |
| Nicaraguans | 0.6 /100 | #251 | Tragic 83.9% |
| Bahamians | 0.6 /100 | #252 | Tragic 83.9% |
| Immigrants | Nicaragua | 0.6 /100 | #253 | Tragic 83.9% |
| Immigrants | St. Vincent and the Grenadines | 0.5 /100 | #254 | Tragic 83.9% |
| Whites/Caucasians | 0.5 /100 | #255 | Tragic 83.9% |
| Immigrants | Lebanon | 0.4 /100 | #256 | Tragic 83.9% |
| Iraqis | 0.3 /100 | #257 | Tragic 83.8% |
| Hondurans | 0.3 /100 | #258 | Tragic 83.8% |
| Scotch-Irish | 0.3 /100 | #259 | Tragic 83.8% |
| Immigrants | Dominican Republic | 0.3 /100 | #260 | Tragic 83.8% |
| Guyanese | 0.3 /100 | #261 | Tragic 83.8% |
| Dominicans | 0.2 /100 | #262 | Tragic 83.8% |
| Immigrants | Guyana | 0.2 /100 | #263 | Tragic 83.8% |
| Guatemalans | 0.2 /100 | #264 | Tragic 83.7% |
| Immigrants | Honduras | 0.1 /100 | #265 | Tragic 83.7% |
Demographics Similar to Immigrants from Kenya by In Labor Force | Age 30-34
In terms of in labor force | age 30-34, the demographic groups most similar to Immigrants from Kenya are Immigrants from Turkey (85.5%, a difference of 0.0%), Filipino (85.5%, a difference of 0.010%), Czech (85.5%, a difference of 0.010%), Russian (85.5%, a difference of 0.010%), and Polish (85.5%, a difference of 0.020%).
| Demographics | Rating | Rank | In Labor Force | Age 30-34 |
| Croatians | 99.8 /100 | #47 | Exceptional 85.6% |
| Immigrants | Sweden | 99.8 /100 | #48 | Exceptional 85.6% |
| Lithuanians | 99.8 /100 | #49 | Exceptional 85.6% |
| Immigrants | Australia | 99.8 /100 | #50 | Exceptional 85.6% |
| Cape Verdeans | 99.7 /100 | #51 | Exceptional 85.6% |
| Slovenes | 99.7 /100 | #52 | Exceptional 85.6% |
| Filipinos | 99.6 /100 | #53 | Exceptional 85.5% |
| Immigrants | Kenya | 99.6 /100 | #54 | Exceptional 85.5% |
| Immigrants | Turkey | 99.6 /100 | #55 | Exceptional 85.5% |
| Czechs | 99.6 /100 | #56 | Exceptional 85.5% |
| Russians | 99.6 /100 | #57 | Exceptional 85.5% |
| Poles | 99.6 /100 | #58 | Exceptional 85.5% |
| Immigrants | Poland | 99.5 /100 | #59 | Exceptional 85.5% |
| Immigrants | France | 99.5 /100 | #60 | Exceptional 85.5% |
| Immigrants | Brazil | 99.5 /100 | #61 | Exceptional 85.5% |