Honduran vs Cajun Divorced or Separated
COMPARE
Honduran
Cajun
Divorced or Separated
Divorced or Separated Comparison
Hondurans
Cajuns
12.8%
DIVORCED OR SEPARATED
0.1/ 100
METRIC RATING
287th/ 347
METRIC RANK
13.4%
DIVORCED OR SEPARATED
0.0/ 100
METRIC RATING
320th/ 347
METRIC RANK
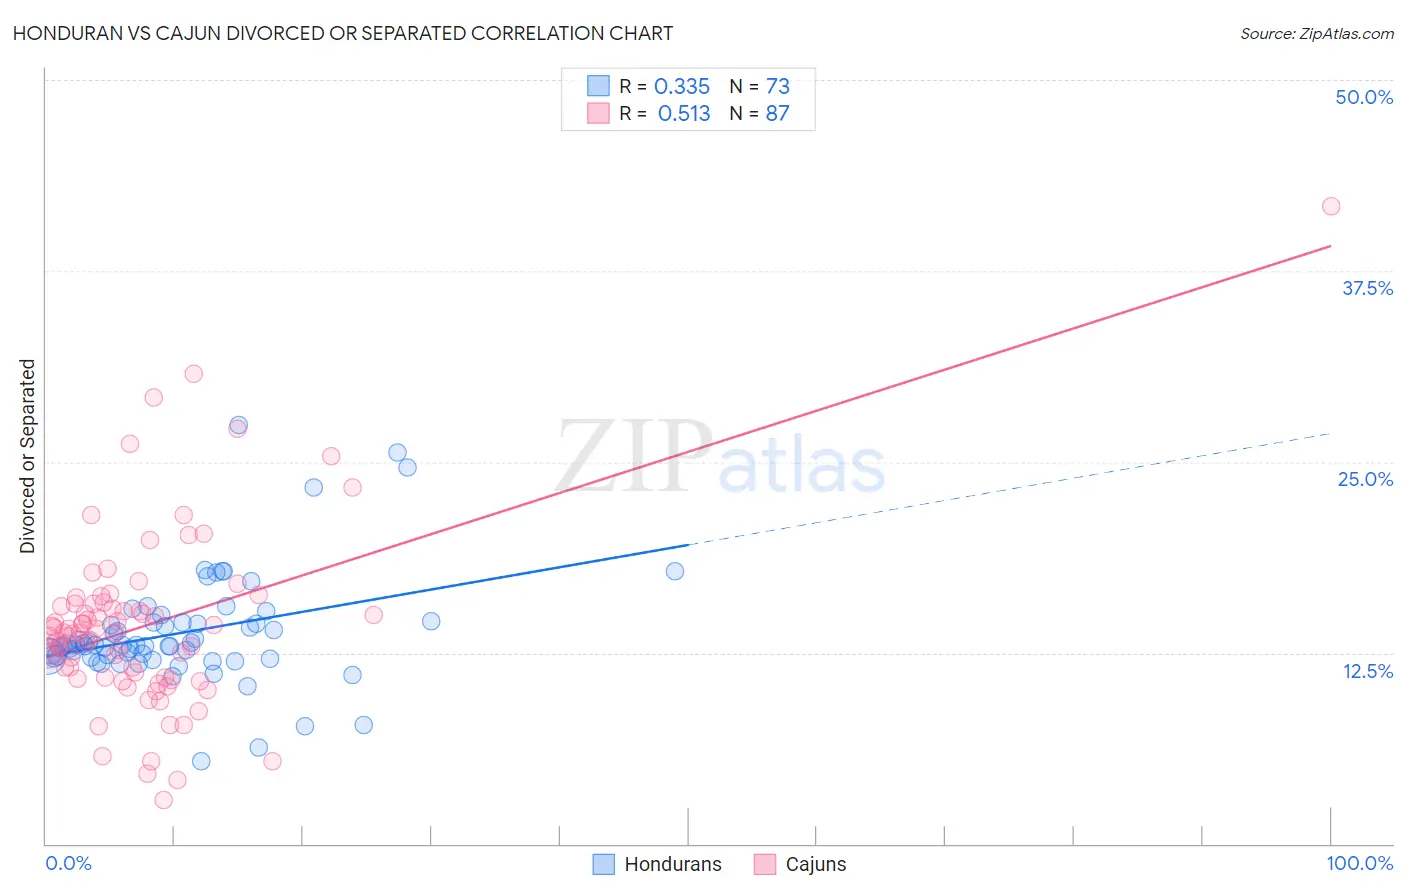
Honduran vs Cajun Divorced or Separated Correlation Chart
The statistical analysis conducted on geographies consisting of 357,724,421 people shows a mild positive correlation between the proportion of Hondurans and percentage of population currently divorced or separated in the United States with a correlation coefficient (R) of 0.335 and weighted average of 12.8%. Similarly, the statistical analysis conducted on geographies consisting of 149,704,067 people shows a substantial positive correlation between the proportion of Cajuns and percentage of population currently divorced or separated in the United States with a correlation coefficient (R) of 0.513 and weighted average of 13.4%, a difference of 4.3%.
Divorced or Separated Correlation Summary
| Measurement | Honduran | Cajun |
| Minimum | 5.4% | 2.9% |
| Maximum | 27.4% | 41.7% |
| Range | 22.0% | 38.8% |
| Mean | 13.8% | 14.3% |
| Median | 13.0% | 13.8% |
| Interquartile 25% (IQ1) | 12.2% | 10.9% |
| Interquartile 75% (IQ3) | 14.5% | 15.7% |
| Interquartile Range (IQR) | 2.3% | 4.9% |
| Standard Deviation (Sample) | 3.6% | 5.9% |
| Standard Deviation (Population) | 3.6% | 5.9% |
Similar Demographics by Divorced or Separated
Demographics Similar to Hondurans by Divorced or Separated
In terms of divorced or separated, the demographic groups most similar to Hondurans are Spanish (12.8%, a difference of 0.19%), French Canadian (12.8%, a difference of 0.26%), French (12.8%, a difference of 0.41%), Iroquois (12.9%, a difference of 0.41%), and Nonimmigrants (12.8%, a difference of 0.45%).
| Demographics | Rating | Rank | Divorced or Separated |
| Immigrants | Zaire | 0.2 /100 | #280 | Tragic 12.7% |
| Pueblo | 0.2 /100 | #281 | Tragic 12.7% |
| Sub-Saharan Africans | 0.1 /100 | #282 | Tragic 12.7% |
| Delaware | 0.1 /100 | #283 | Tragic 12.7% |
| Immigrants | Nonimmigrants | 0.1 /100 | #284 | Tragic 12.8% |
| French | 0.1 /100 | #285 | Tragic 12.8% |
| Spanish | 0.1 /100 | #286 | Tragic 12.8% |
| Hondurans | 0.1 /100 | #287 | Tragic 12.8% |
| French Canadians | 0.1 /100 | #288 | Tragic 12.8% |
| Iroquois | 0.0 /100 | #289 | Tragic 12.9% |
| Pima | 0.0 /100 | #290 | Tragic 12.9% |
| Immigrants | Honduras | 0.0 /100 | #291 | Tragic 12.9% |
| Scotch-Irish | 0.0 /100 | #292 | Tragic 12.9% |
| Jamaicans | 0.0 /100 | #293 | Tragic 12.9% |
| Apache | 0.0 /100 | #294 | Tragic 12.9% |
Demographics Similar to Cajuns by Divorced or Separated
In terms of divorced or separated, the demographic groups most similar to Cajuns are Puget Sound Salish (13.4%, a difference of 0.060%), Cree (13.4%, a difference of 0.10%), Cheyenne (13.4%, a difference of 0.10%), Haitian (13.3%, a difference of 0.12%), and Tsimshian (13.3%, a difference of 0.14%).
| Demographics | Rating | Rank | Divorced or Separated |
| Immigrants | Nicaragua | 0.0 /100 | #313 | Tragic 13.3% |
| Yaqui | 0.0 /100 | #314 | Tragic 13.3% |
| Spanish Americans | 0.0 /100 | #315 | Tragic 13.3% |
| Tsimshian | 0.0 /100 | #316 | Tragic 13.3% |
| Haitians | 0.0 /100 | #317 | Tragic 13.3% |
| Cree | 0.0 /100 | #318 | Tragic 13.4% |
| Puget Sound Salish | 0.0 /100 | #319 | Tragic 13.4% |
| Cajuns | 0.0 /100 | #320 | Tragic 13.4% |
| Cheyenne | 0.0 /100 | #321 | Tragic 13.4% |
| Immigrants | Haiti | 0.0 /100 | #322 | Tragic 13.4% |
| U.S. Virgin Islanders | 0.0 /100 | #323 | Tragic 13.4% |
| Osage | 0.0 /100 | #324 | Tragic 13.4% |
| Potawatomi | 0.0 /100 | #325 | Tragic 13.5% |
| Immigrants | Congo | 0.0 /100 | #326 | Tragic 13.5% |
| Comanche | 0.0 /100 | #327 | Tragic 13.5% |