Honduran vs Ute Divorced or Separated
COMPARE
Honduran
Ute
Divorced or Separated
Divorced or Separated Comparison
Hondurans
Ute
12.8%
DIVORCED OR SEPARATED
0.1/ 100
METRIC RATING
287th/ 347
METRIC RANK
12.6%
DIVORCED OR SEPARATED
0.4/ 100
METRIC RATING
270th/ 347
METRIC RANK
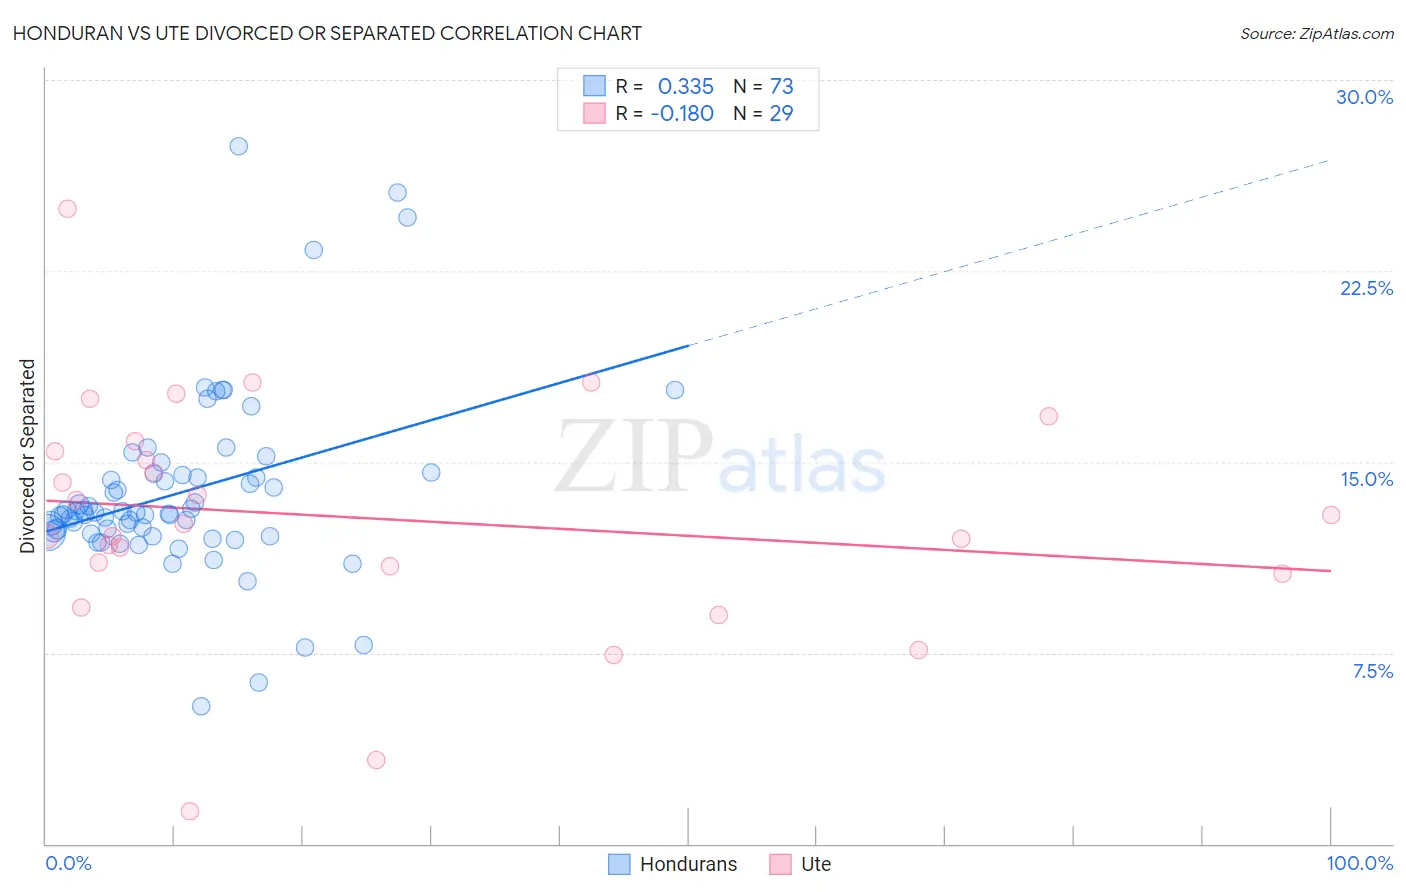
Honduran vs Ute Divorced or Separated Correlation Chart
The statistical analysis conducted on geographies consisting of 357,724,421 people shows a mild positive correlation between the proportion of Hondurans and percentage of population currently divorced or separated in the United States with a correlation coefficient (R) of 0.335 and weighted average of 12.8%. Similarly, the statistical analysis conducted on geographies consisting of 55,667,313 people shows a poor negative correlation between the proportion of Ute and percentage of population currently divorced or separated in the United States with a correlation coefficient (R) of -0.180 and weighted average of 12.6%, a difference of 1.3%.
Divorced or Separated Correlation Summary
| Measurement | Honduran | Ute |
| Minimum | 5.4% | 1.3% |
| Maximum | 27.4% | 24.9% |
| Range | 22.0% | 23.6% |
| Mean | 13.8% | 12.8% |
| Median | 13.0% | 12.6% |
| Interquartile 25% (IQ1) | 12.2% | 10.7% |
| Interquartile 75% (IQ3) | 14.5% | 15.6% |
| Interquartile Range (IQR) | 2.3% | 4.9% |
| Standard Deviation (Sample) | 3.6% | 4.7% |
| Standard Deviation (Population) | 3.6% | 4.6% |
Demographics Similar to Hondurans and Ute by Divorced or Separated
In terms of divorced or separated, the demographic groups most similar to Hondurans are Spanish (12.8%, a difference of 0.19%), French Canadian (12.8%, a difference of 0.26%), French (12.8%, a difference of 0.41%), Nonimmigrants (12.8%, a difference of 0.45%), and Delaware (12.7%, a difference of 0.54%). Similarly, the demographic groups most similar to Ute are Panamanian (12.7%, a difference of 0.060%), Immigrants from Middle Africa (12.7%, a difference of 0.11%), Immigrants from Liberia (12.6%, a difference of 0.12%), Fijian (12.6%, a difference of 0.13%), and Immigrants from Micronesia (12.7%, a difference of 0.22%).
| Demographics | Rating | Rank | Divorced or Separated |
| Fijians | 0.4 /100 | #268 | Tragic 12.6% |
| Immigrants | Liberia | 0.4 /100 | #269 | Tragic 12.6% |
| Ute | 0.4 /100 | #270 | Tragic 12.6% |
| Panamanians | 0.3 /100 | #271 | Tragic 12.7% |
| Immigrants | Middle Africa | 0.3 /100 | #272 | Tragic 12.7% |
| Immigrants | Micronesia | 0.3 /100 | #273 | Tragic 12.7% |
| Bermudans | 0.3 /100 | #274 | Tragic 12.7% |
| Central American Indians | 0.3 /100 | #275 | Tragic 12.7% |
| Spaniards | 0.2 /100 | #276 | Tragic 12.7% |
| Dominicans | 0.2 /100 | #277 | Tragic 12.7% |
| Lumbee | 0.2 /100 | #278 | Tragic 12.7% |
| Immigrants | Dominican Republic | 0.2 /100 | #279 | Tragic 12.7% |
| Immigrants | Zaire | 0.2 /100 | #280 | Tragic 12.7% |
| Pueblo | 0.2 /100 | #281 | Tragic 12.7% |
| Sub-Saharan Africans | 0.1 /100 | #282 | Tragic 12.7% |
| Delaware | 0.1 /100 | #283 | Tragic 12.7% |
| Immigrants | Nonimmigrants | 0.1 /100 | #284 | Tragic 12.8% |
| French | 0.1 /100 | #285 | Tragic 12.8% |
| Spanish | 0.1 /100 | #286 | Tragic 12.8% |
| Hondurans | 0.1 /100 | #287 | Tragic 12.8% |
| French Canadians | 0.1 /100 | #288 | Tragic 12.8% |