Hmong vs Immigrants from Bolivia Family Households
COMPARE
Hmong
Immigrants from Bolivia
Family Households
Family Households Comparison
Hmong
Immigrants from Bolivia
64.9%
FAMILY HOUSEHOLDS
93.4/ 100
METRIC RATING
122nd/ 347
METRIC RANK
66.6%
FAMILY HOUSEHOLDS
100.0/ 100
METRIC RATING
41st/ 347
METRIC RANK
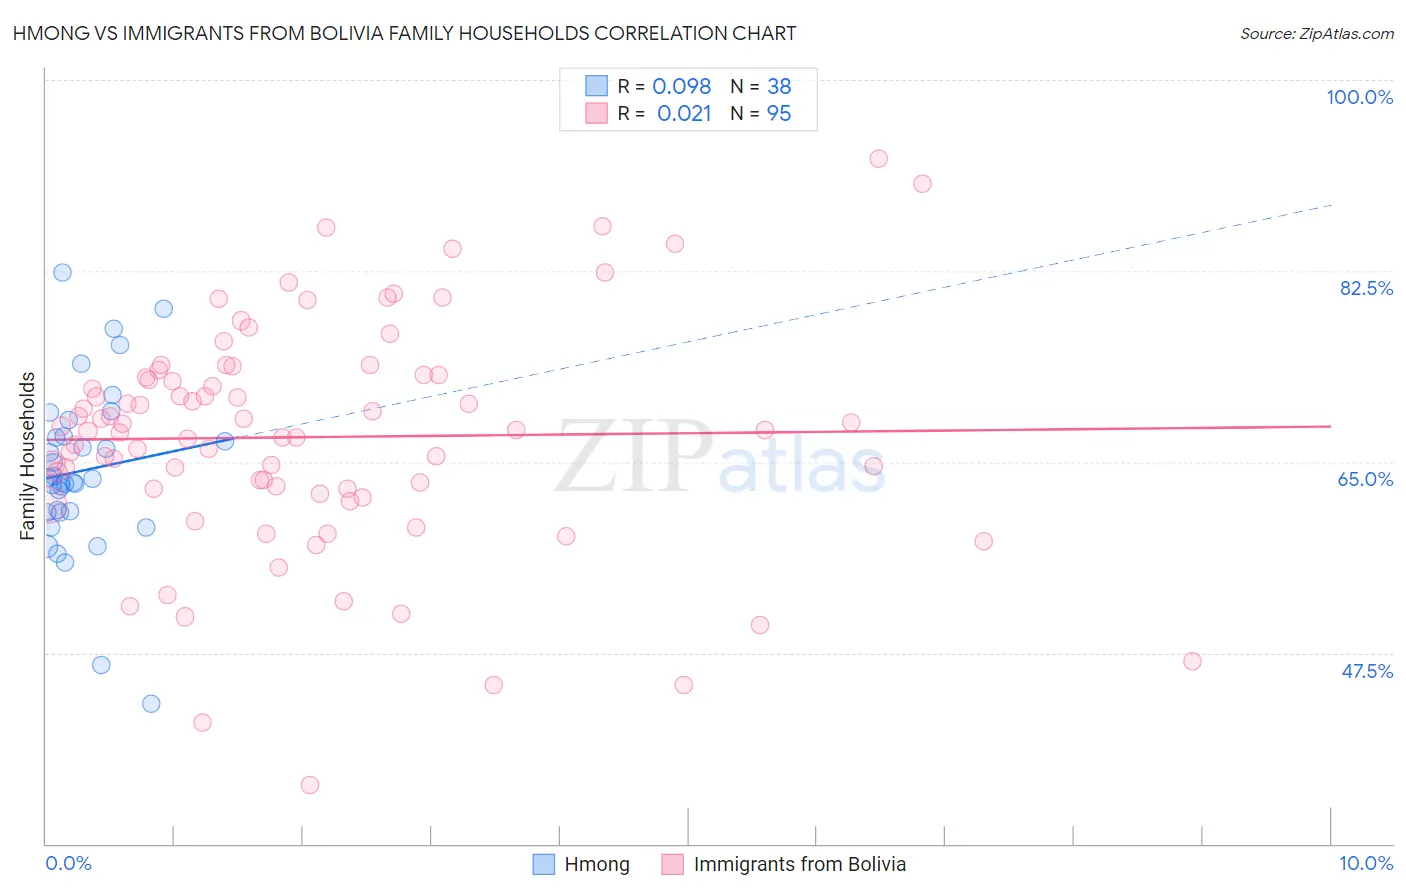
Hmong vs Immigrants from Bolivia Family Households Correlation Chart
The statistical analysis conducted on geographies consisting of 24,604,422 people shows a slight positive correlation between the proportion of Hmong and percentage of family households in the United States with a correlation coefficient (R) of 0.098 and weighted average of 64.9%. Similarly, the statistical analysis conducted on geographies consisting of 158,720,883 people shows no correlation between the proportion of Immigrants from Bolivia and percentage of family households in the United States with a correlation coefficient (R) of 0.021 and weighted average of 66.6%, a difference of 2.6%.
Family Households Correlation Summary
| Measurement | Hmong | Immigrants from Bolivia |
| Minimum | 42.8% | 35.4% |
| Maximum | 82.3% | 92.8% |
| Range | 39.5% | 57.4% |
| Mean | 64.2% | 67.3% |
| Median | 63.3% | 67.9% |
| Interquartile 25% (IQ1) | 60.4% | 62.5% |
| Interquartile 75% (IQ3) | 67.3% | 73.0% |
| Interquartile Range (IQR) | 6.9% | 10.5% |
| Standard Deviation (Sample) | 7.8% | 10.5% |
| Standard Deviation (Population) | 7.7% | 10.4% |
Similar Demographics by Family Households
Demographics Similar to Hmong by Family Households
In terms of family households, the demographic groups most similar to Hmong are Choctaw (64.9%, a difference of 0.0%), Immigrants from Argentina (64.9%, a difference of 0.030%), Immigrants from Belize (64.9%, a difference of 0.030%), Hungarian (64.9%, a difference of 0.040%), and Immigrants from Oceania (64.9%, a difference of 0.050%).
| Demographics | Rating | Rank | Family Households |
| Ecuadorians | 95.4 /100 | #115 | Exceptional 65.0% |
| Immigrants | Iraq | 95.4 /100 | #116 | Exceptional 65.0% |
| Cherokee | 95.3 /100 | #117 | Exceptional 65.0% |
| Dutch | 95.1 /100 | #118 | Exceptional 64.9% |
| Immigrants | Eastern Asia | 94.4 /100 | #119 | Exceptional 64.9% |
| Immigrants | Oceania | 94.2 /100 | #120 | Exceptional 64.9% |
| Hungarians | 94.0 /100 | #121 | Exceptional 64.9% |
| Hmong | 93.4 /100 | #122 | Exceptional 64.9% |
| Choctaw | 93.4 /100 | #123 | Exceptional 64.9% |
| Immigrants | Argentina | 92.8 /100 | #124 | Exceptional 64.9% |
| Immigrants | Belize | 92.7 /100 | #125 | Exceptional 64.9% |
| Panamanians | 92.4 /100 | #126 | Exceptional 64.8% |
| Immigrants | Panama | 92.0 /100 | #127 | Exceptional 64.8% |
| Italians | 91.9 /100 | #128 | Exceptional 64.8% |
| Immigrants | Ecuador | 91.4 /100 | #129 | Exceptional 64.8% |
Demographics Similar to Immigrants from Bolivia by Family Households
In terms of family households, the demographic groups most similar to Immigrants from Bolivia are Guamanian/Chamorro (66.6%, a difference of 0.030%), Menominee (66.5%, a difference of 0.060%), Apache (66.5%, a difference of 0.070%), Asian (66.5%, a difference of 0.11%), and Venezuelan (66.5%, a difference of 0.14%).
| Demographics | Rating | Rank | Family Households |
| Thais | 100.0 /100 | #34 | Exceptional 67.2% |
| Tohono O'odham | 100.0 /100 | #35 | Exceptional 67.1% |
| Peruvians | 100.0 /100 | #36 | Exceptional 67.1% |
| Tsimshian | 100.0 /100 | #37 | Exceptional 67.1% |
| Mexican American Indians | 100.0 /100 | #38 | Exceptional 67.0% |
| Immigrants | El Salvador | 100.0 /100 | #39 | Exceptional 67.0% |
| Guamanians/Chamorros | 100.0 /100 | #40 | Exceptional 66.6% |
| Immigrants | Bolivia | 100.0 /100 | #41 | Exceptional 66.6% |
| Menominee | 100.0 /100 | #42 | Exceptional 66.5% |
| Apache | 100.0 /100 | #43 | Exceptional 66.5% |
| Asians | 100.0 /100 | #44 | Exceptional 66.5% |
| Venezuelans | 100.0 /100 | #45 | Exceptional 66.5% |
| Arapaho | 100.0 /100 | #46 | Exceptional 66.5% |
| Bolivians | 100.0 /100 | #47 | Exceptional 66.5% |
| Immigrants | Venezuela | 100.0 /100 | #48 | Exceptional 66.4% |