Swedish vs Immigrants from Bolivia Family Households
COMPARE
Swedish
Immigrants from Bolivia
Family Households
Family Households Comparison
Swedes
Immigrants from Bolivia
64.5%
FAMILY HOUSEHOLDS
69.8/ 100
METRIC RATING
153rd/ 347
METRIC RANK
66.6%
FAMILY HOUSEHOLDS
100.0/ 100
METRIC RATING
41st/ 347
METRIC RANK
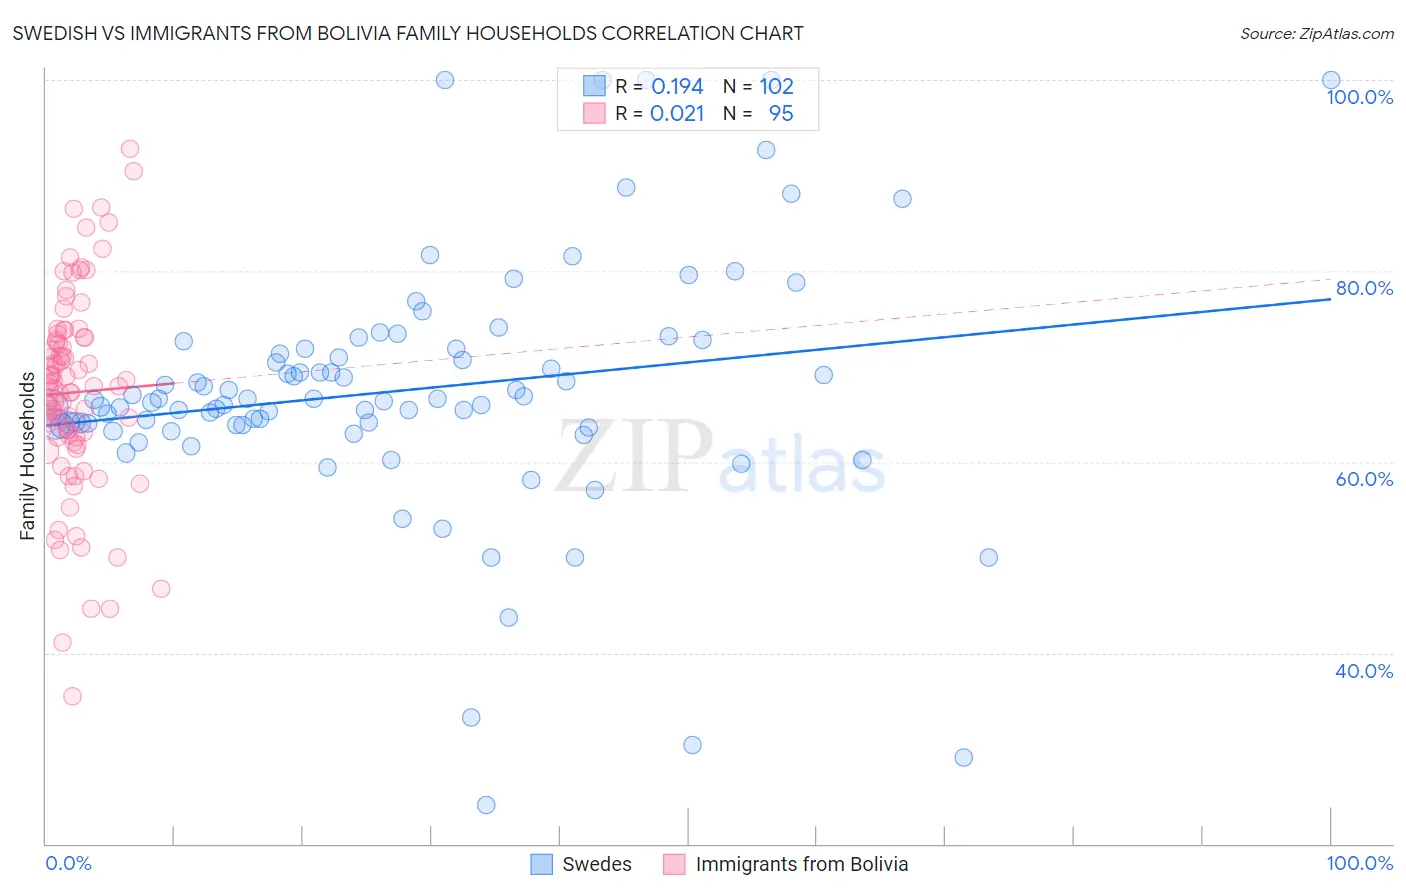
Swedish vs Immigrants from Bolivia Family Households Correlation Chart
The statistical analysis conducted on geographies consisting of 538,762,235 people shows a poor positive correlation between the proportion of Swedes and percentage of family households in the United States with a correlation coefficient (R) of 0.194 and weighted average of 64.5%. Similarly, the statistical analysis conducted on geographies consisting of 158,720,883 people shows no correlation between the proportion of Immigrants from Bolivia and percentage of family households in the United States with a correlation coefficient (R) of 0.021 and weighted average of 66.6%, a difference of 3.3%.
Family Households Correlation Summary
| Measurement | Swedish | Immigrants from Bolivia |
| Minimum | 24.0% | 35.4% |
| Maximum | 100.0% | 92.8% |
| Range | 76.0% | 57.4% |
| Mean | 67.5% | 67.3% |
| Median | 66.4% | 67.9% |
| Interquartile 25% (IQ1) | 63.8% | 62.5% |
| Interquartile 75% (IQ3) | 71.8% | 73.0% |
| Interquartile Range (IQR) | 8.0% | 10.5% |
| Standard Deviation (Sample) | 13.1% | 10.5% |
| Standard Deviation (Population) | 13.0% | 10.4% |
Similar Demographics by Family Households
Demographics Similar to Swedes by Family Households
In terms of family households, the demographic groups most similar to Swedes are Scottish (64.5%, a difference of 0.020%), Austrian (64.5%, a difference of 0.020%), Uruguayan (64.5%, a difference of 0.030%), Czech (64.5%, a difference of 0.040%), and Canadian (64.4%, a difference of 0.050%).
| Demographics | Rating | Rank | Family Households |
| Immigrants | Romania | 77.0 /100 | #146 | Good 64.6% |
| Immigrants | Chile | 76.5 /100 | #147 | Good 64.6% |
| Delaware | 76.3 /100 | #148 | Good 64.6% |
| Sioux | 76.3 /100 | #149 | Good 64.6% |
| Romanians | 75.3 /100 | #150 | Good 64.5% |
| Syrians | 75.2 /100 | #151 | Good 64.5% |
| Scottish | 70.9 /100 | #152 | Good 64.5% |
| Swedes | 69.8 /100 | #153 | Good 64.5% |
| Austrians | 68.5 /100 | #154 | Good 64.5% |
| Uruguayans | 67.7 /100 | #155 | Good 64.5% |
| Czechs | 67.0 /100 | #156 | Good 64.5% |
| Canadians | 66.6 /100 | #157 | Good 64.4% |
| Lebanese | 66.4 /100 | #158 | Good 64.4% |
| Germans | 65.8 /100 | #159 | Good 64.4% |
| Immigrants | Moldova | 65.2 /100 | #160 | Good 64.4% |
Demographics Similar to Immigrants from Bolivia by Family Households
In terms of family households, the demographic groups most similar to Immigrants from Bolivia are Guamanian/Chamorro (66.6%, a difference of 0.030%), Menominee (66.5%, a difference of 0.060%), Apache (66.5%, a difference of 0.070%), Asian (66.5%, a difference of 0.11%), and Venezuelan (66.5%, a difference of 0.14%).
| Demographics | Rating | Rank | Family Households |
| Thais | 100.0 /100 | #34 | Exceptional 67.2% |
| Tohono O'odham | 100.0 /100 | #35 | Exceptional 67.1% |
| Peruvians | 100.0 /100 | #36 | Exceptional 67.1% |
| Tsimshian | 100.0 /100 | #37 | Exceptional 67.1% |
| Mexican American Indians | 100.0 /100 | #38 | Exceptional 67.0% |
| Immigrants | El Salvador | 100.0 /100 | #39 | Exceptional 67.0% |
| Guamanians/Chamorros | 100.0 /100 | #40 | Exceptional 66.6% |
| Immigrants | Bolivia | 100.0 /100 | #41 | Exceptional 66.6% |
| Menominee | 100.0 /100 | #42 | Exceptional 66.5% |
| Apache | 100.0 /100 | #43 | Exceptional 66.5% |
| Asians | 100.0 /100 | #44 | Exceptional 66.5% |
| Venezuelans | 100.0 /100 | #45 | Exceptional 66.5% |
| Arapaho | 100.0 /100 | #46 | Exceptional 66.5% |
| Bolivians | 100.0 /100 | #47 | Exceptional 66.5% |
| Immigrants | Venezuela | 100.0 /100 | #48 | Exceptional 66.4% |