Immigrants from Pakistan vs Immigrants from Bolivia Family Households
COMPARE
Immigrants from Pakistan
Immigrants from Bolivia
Family Households
Family Households Comparison
Immigrants from Pakistan
Immigrants from Bolivia
67.7%
FAMILY HOUSEHOLDS
100.0/ 100
METRIC RATING
23rd/ 347
METRIC RANK
66.6%
FAMILY HOUSEHOLDS
100.0/ 100
METRIC RATING
41st/ 347
METRIC RANK
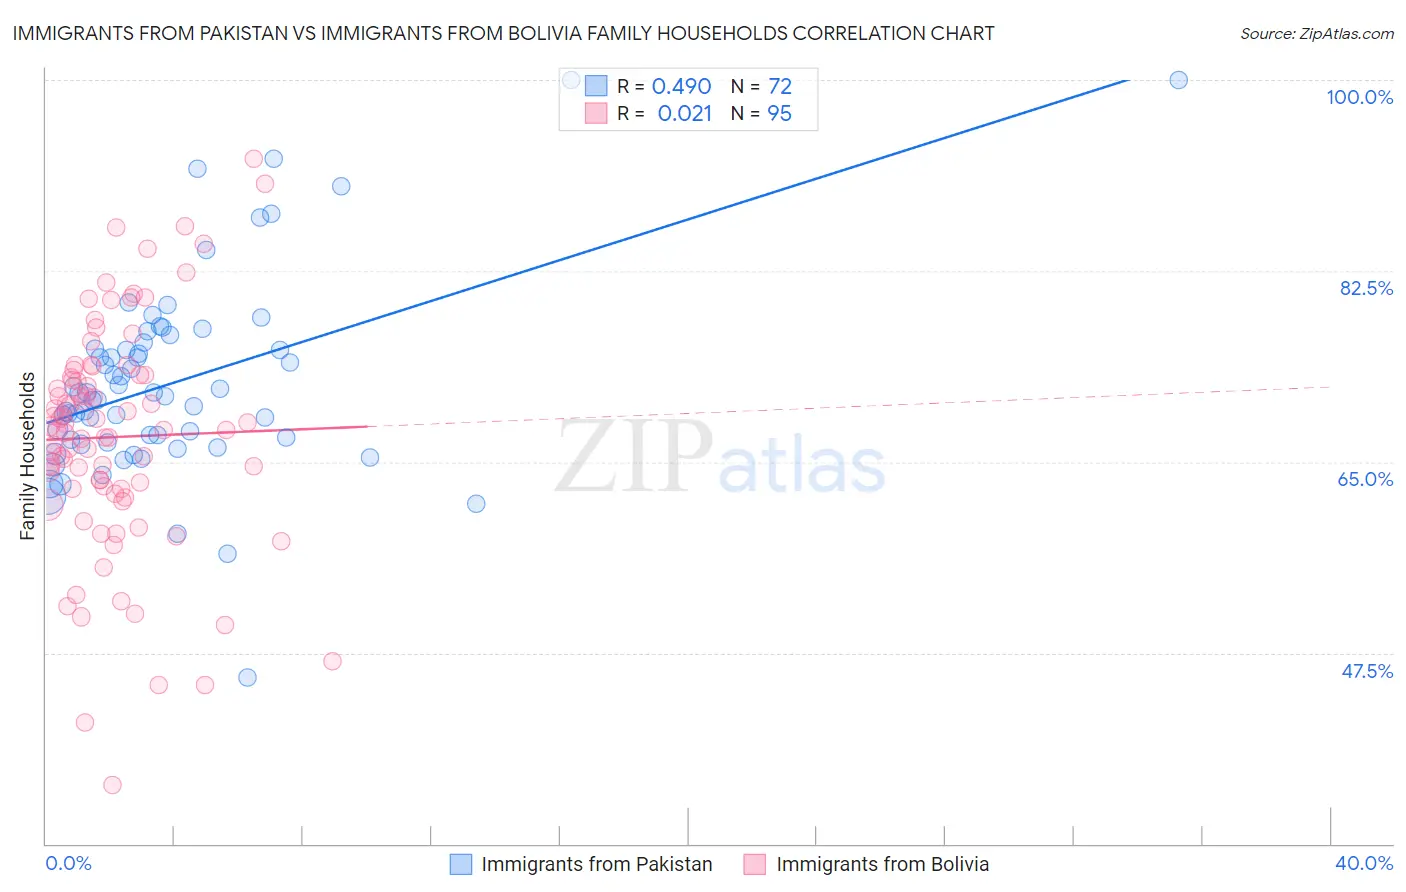
Immigrants from Pakistan vs Immigrants from Bolivia Family Households Correlation Chart
The statistical analysis conducted on geographies consisting of 283,802,176 people shows a moderate positive correlation between the proportion of Immigrants from Pakistan and percentage of family households in the United States with a correlation coefficient (R) of 0.490 and weighted average of 67.7%. Similarly, the statistical analysis conducted on geographies consisting of 158,720,883 people shows no correlation between the proportion of Immigrants from Bolivia and percentage of family households in the United States with a correlation coefficient (R) of 0.021 and weighted average of 66.6%, a difference of 1.6%.
Family Households Correlation Summary
| Measurement | Immigrants from Pakistan | Immigrants from Bolivia |
| Minimum | 45.3% | 35.4% |
| Maximum | 100.0% | 92.8% |
| Range | 54.7% | 57.4% |
| Mean | 72.3% | 67.3% |
| Median | 71.1% | 67.9% |
| Interquartile 25% (IQ1) | 66.9% | 62.5% |
| Interquartile 75% (IQ3) | 75.7% | 73.0% |
| Interquartile Range (IQR) | 8.8% | 10.5% |
| Standard Deviation (Sample) | 9.1% | 10.5% |
| Standard Deviation (Population) | 9.1% | 10.4% |
Demographics Similar to Immigrants from Pakistan and Immigrants from Bolivia by Family Households
In terms of family households, the demographic groups most similar to Immigrants from Pakistan are Sri Lankan (67.7%, a difference of 0.090%), Immigrants from South Eastern Asia (67.5%, a difference of 0.28%), Immigrants from Nicaragua (67.5%, a difference of 0.31%), Immigrants from India (67.4%, a difference of 0.32%), and Hispanic or Latino (67.4%, a difference of 0.36%). Similarly, the demographic groups most similar to Immigrants from Bolivia are Guamanian/Chamorro (66.6%, a difference of 0.030%), Menominee (66.5%, a difference of 0.060%), Immigrants from El Salvador (67.0%, a difference of 0.62%), Mexican American Indian (67.0%, a difference of 0.64%), and Tsimshian (67.1%, a difference of 0.74%).
| Demographics | Rating | Rank | Family Households |
| Sri Lankans | 100.0 /100 | #22 | Exceptional 67.7% |
| Immigrants | Pakistan | 100.0 /100 | #23 | Exceptional 67.7% |
| Immigrants | South Eastern Asia | 100.0 /100 | #24 | Exceptional 67.5% |
| Immigrants | Nicaragua | 100.0 /100 | #25 | Exceptional 67.5% |
| Immigrants | India | 100.0 /100 | #26 | Exceptional 67.4% |
| Hispanics or Latinos | 100.0 /100 | #27 | Exceptional 67.4% |
| Hawaiians | 100.0 /100 | #28 | Exceptional 67.4% |
| Nicaraguans | 100.0 /100 | #29 | Exceptional 67.4% |
| Immigrants | Peru | 100.0 /100 | #30 | Exceptional 67.2% |
| Immigrants | Latin America | 100.0 /100 | #31 | Exceptional 67.2% |
| Nepalese | 100.0 /100 | #32 | Exceptional 67.2% |
| Salvadorans | 100.0 /100 | #33 | Exceptional 67.2% |
| Thais | 100.0 /100 | #34 | Exceptional 67.2% |
| Tohono O'odham | 100.0 /100 | #35 | Exceptional 67.1% |
| Peruvians | 100.0 /100 | #36 | Exceptional 67.1% |
| Tsimshian | 100.0 /100 | #37 | Exceptional 67.1% |
| Mexican American Indians | 100.0 /100 | #38 | Exceptional 67.0% |
| Immigrants | El Salvador | 100.0 /100 | #39 | Exceptional 67.0% |
| Guamanians/Chamorros | 100.0 /100 | #40 | Exceptional 66.6% |
| Immigrants | Bolivia | 100.0 /100 | #41 | Exceptional 66.6% |
| Menominee | 100.0 /100 | #42 | Exceptional 66.5% |