Hmong vs Immigrants from Bolivia Householder Income Ages 45 - 64 years
COMPARE
Hmong
Immigrants from Bolivia
Householder Income Ages 45 - 64 years
Householder Income Ages 45 - 64 years Comparison
Hmong
Immigrants from Bolivia
$88,115
HOUSEHOLDER INCOME AGES 45 - 64 YEARS
0.2/ 100
METRIC RATING
267th/ 347
METRIC RANK
$117,731
HOUSEHOLDER INCOME AGES 45 - 64 YEARS
100.0/ 100
METRIC RATING
30th/ 347
METRIC RANK
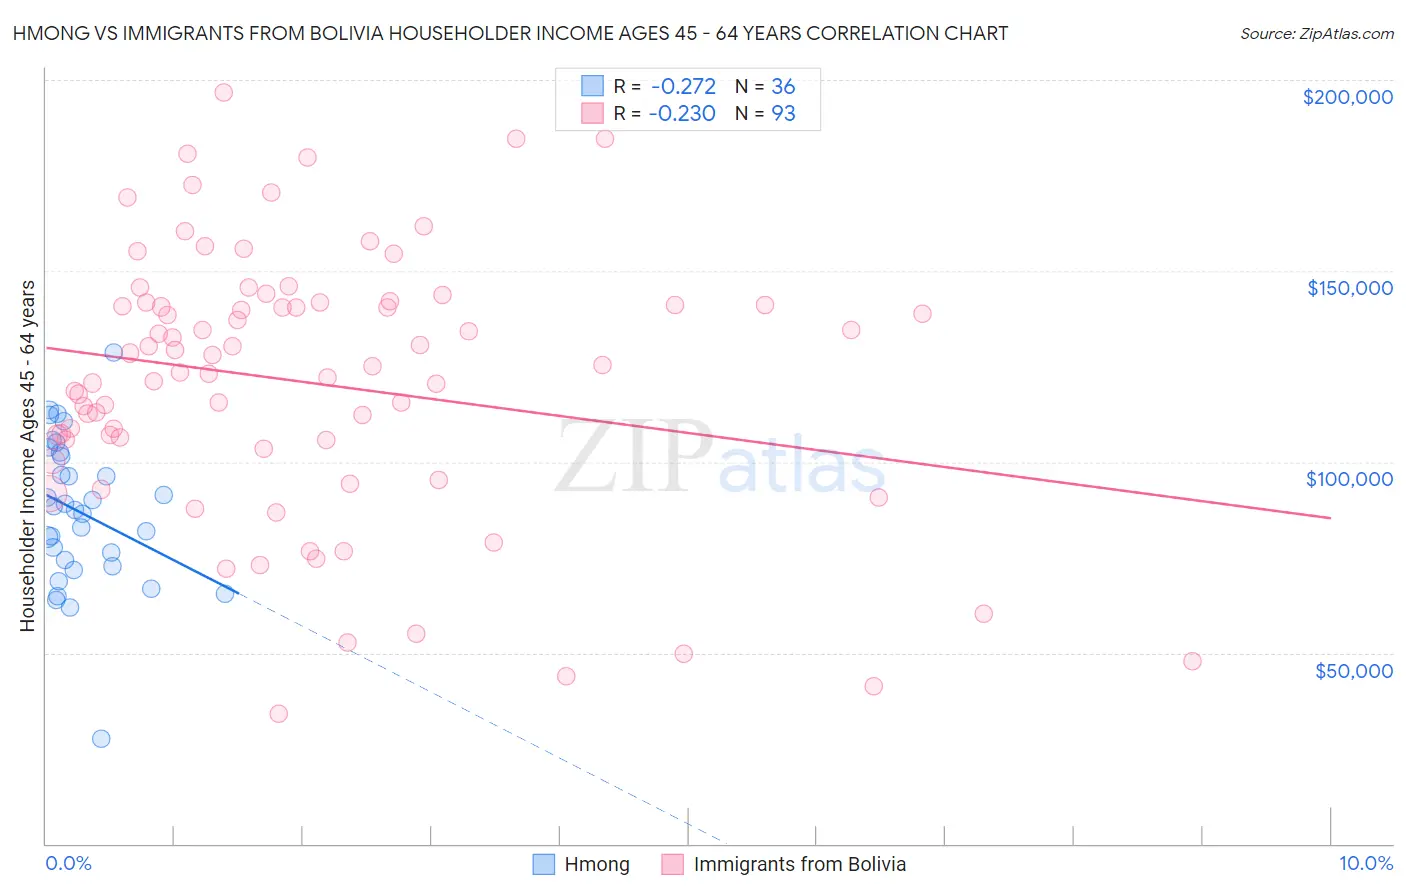
Hmong vs Immigrants from Bolivia Householder Income Ages 45 - 64 years Correlation Chart
The statistical analysis conducted on geographies consisting of 24,653,946 people shows a weak negative correlation between the proportion of Hmong and household income with householder between the ages 45 and 64 in the United States with a correlation coefficient (R) of -0.272 and weighted average of $88,115. Similarly, the statistical analysis conducted on geographies consisting of 158,694,143 people shows a weak negative correlation between the proportion of Immigrants from Bolivia and household income with householder between the ages 45 and 64 in the United States with a correlation coefficient (R) of -0.230 and weighted average of $117,731, a difference of 33.6%.
Householder Income Ages 45 - 64 years Correlation Summary
| Measurement | Hmong | Immigrants from Bolivia |
| Minimum | $27,563 | $33,906 |
| Maximum | $128,750 | $196,601 |
| Range | $101,187 | $162,695 |
| Mean | $86,810 | $120,740 |
| Median | $88,019 | $124,893 |
| Interquartile 25% (IQ1) | $73,534 | $104,523 |
| Interquartile 75% (IQ3) | $101,905 | $141,314 |
| Interquartile Range (IQR) | $28,372 | $36,791 |
| Standard Deviation (Sample) | $19,538 | $34,819 |
| Standard Deviation (Population) | $19,264 | $34,631 |
Similar Demographics by Householder Income Ages 45 - 64 years
Demographics Similar to Hmong by Householder Income Ages 45 - 64 years
In terms of householder income ages 45 - 64 years, the demographic groups most similar to Hmong are Immigrants from West Indies ($88,164, a difference of 0.050%), Jamaican ($88,327, a difference of 0.24%), Immigrants from Micronesia ($87,864, a difference of 0.29%), Osage ($88,390, a difference of 0.31%), and Spanish American ($87,836, a difference of 0.32%).
| Demographics | Rating | Rank | Householder Income Ages 45 - 64 years |
| Liberians | 0.3 /100 | #260 | Tragic $88,929 |
| Belizeans | 0.3 /100 | #261 | Tragic $88,684 |
| Somalis | 0.3 /100 | #262 | Tragic $88,600 |
| Immigrants | Senegal | 0.3 /100 | #263 | Tragic $88,421 |
| Osage | 0.3 /100 | #264 | Tragic $88,390 |
| Jamaicans | 0.2 /100 | #265 | Tragic $88,327 |
| Immigrants | West Indies | 0.2 /100 | #266 | Tragic $88,164 |
| Hmong | 0.2 /100 | #267 | Tragic $88,115 |
| Immigrants | Micronesia | 0.2 /100 | #268 | Tragic $87,864 |
| Spanish Americans | 0.2 /100 | #269 | Tragic $87,836 |
| Immigrants | Liberia | 0.2 /100 | #270 | Tragic $87,739 |
| Guatemalans | 0.2 /100 | #271 | Tragic $87,705 |
| Cape Verdeans | 0.2 /100 | #272 | Tragic $87,580 |
| Spanish American Indians | 0.2 /100 | #273 | Tragic $87,561 |
| Iroquois | 0.1 /100 | #274 | Tragic $87,255 |
Demographics Similar to Immigrants from Bolivia by Householder Income Ages 45 - 64 years
In terms of householder income ages 45 - 64 years, the demographic groups most similar to Immigrants from Bolivia are Bhutanese ($117,750, a difference of 0.020%), Turkish ($117,814, a difference of 0.070%), Immigrants from Northern Europe ($117,930, a difference of 0.17%), Immigrants from Sweden ($118,318, a difference of 0.50%), and Asian ($118,426, a difference of 0.59%).
| Demographics | Rating | Rank | Householder Income Ages 45 - 64 years |
| Bolivians | 100.0 /100 | #23 | Exceptional $118,871 |
| Immigrants | Japan | 100.0 /100 | #24 | Exceptional $118,498 |
| Asians | 100.0 /100 | #25 | Exceptional $118,426 |
| Immigrants | Sweden | 100.0 /100 | #26 | Exceptional $118,318 |
| Immigrants | Northern Europe | 100.0 /100 | #27 | Exceptional $117,930 |
| Turks | 100.0 /100 | #28 | Exceptional $117,814 |
| Bhutanese | 100.0 /100 | #29 | Exceptional $117,750 |
| Immigrants | Bolivia | 100.0 /100 | #30 | Exceptional $117,731 |
| Immigrants | Asia | 100.0 /100 | #31 | Exceptional $116,566 |
| Russians | 100.0 /100 | #32 | Exceptional $116,328 |
| Chinese | 100.0 /100 | #33 | Exceptional $116,156 |
| Immigrants | Denmark | 100.0 /100 | #34 | Exceptional $116,000 |
| Latvians | 100.0 /100 | #35 | Exceptional $115,957 |
| Immigrants | Switzerland | 100.0 /100 | #36 | Exceptional $115,934 |
| Maltese | 99.9 /100 | #37 | Exceptional $114,754 |