Trinidadian and Tobagonian vs Immigrants from Bolivia Family Households
COMPARE
Trinidadian and Tobagonian
Immigrants from Bolivia
Family Households
Family Households Comparison
Trinidadians and Tobagonians
Immigrants from Bolivia
63.6%
FAMILY HOUSEHOLDS
4.1/ 100
METRIC RATING
227th/ 347
METRIC RANK
66.6%
FAMILY HOUSEHOLDS
100.0/ 100
METRIC RATING
41st/ 347
METRIC RANK
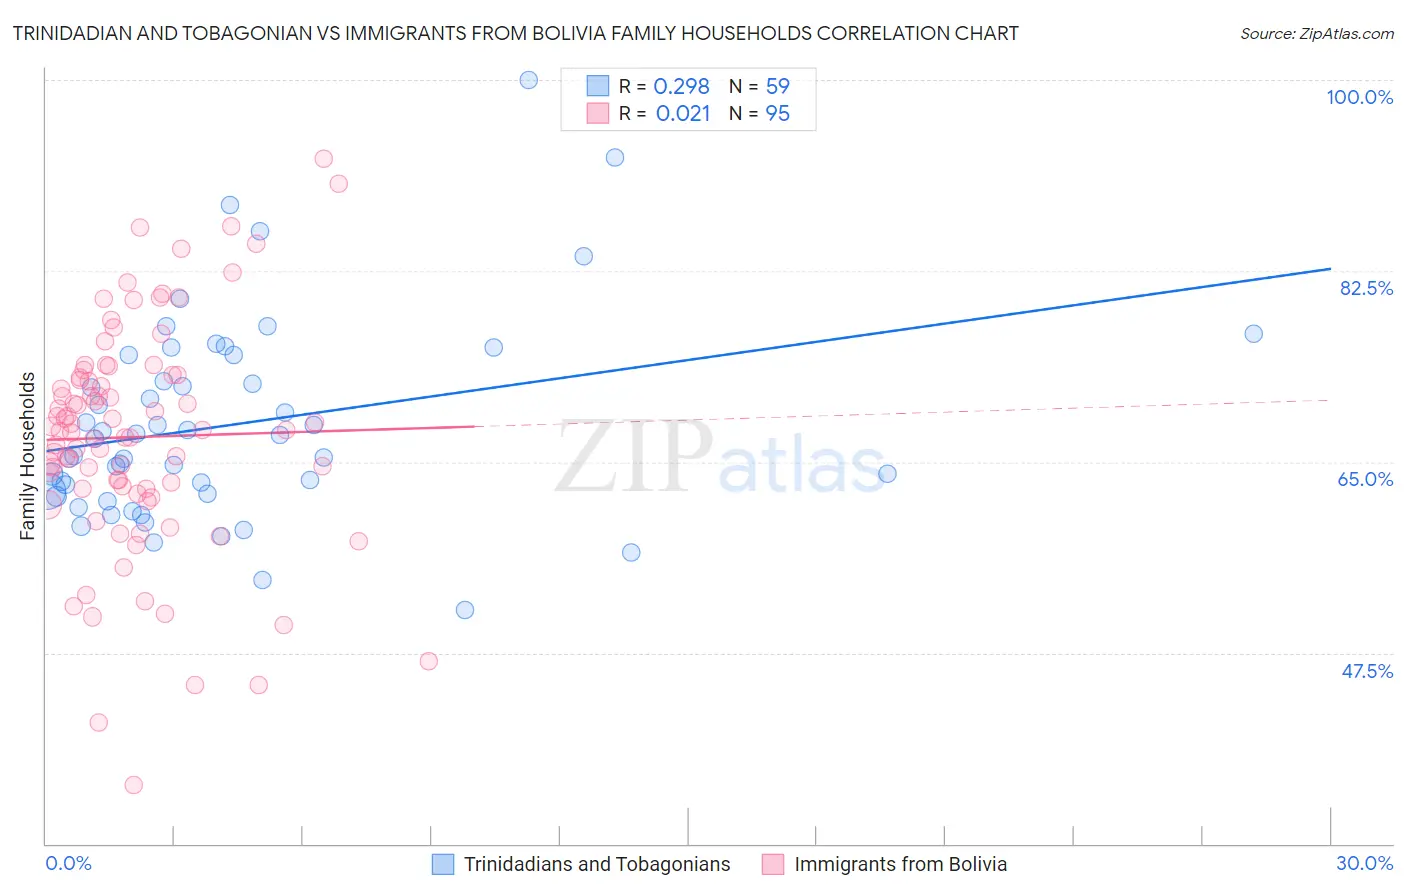
Trinidadian and Tobagonian vs Immigrants from Bolivia Family Households Correlation Chart
The statistical analysis conducted on geographies consisting of 219,716,618 people shows a weak positive correlation between the proportion of Trinidadians and Tobagonians and percentage of family households in the United States with a correlation coefficient (R) of 0.298 and weighted average of 63.6%. Similarly, the statistical analysis conducted on geographies consisting of 158,720,883 people shows no correlation between the proportion of Immigrants from Bolivia and percentage of family households in the United States with a correlation coefficient (R) of 0.021 and weighted average of 66.6%, a difference of 4.7%.
Family Households Correlation Summary
| Measurement | Trinidadian and Tobagonian | Immigrants from Bolivia |
| Minimum | 51.4% | 35.4% |
| Maximum | 100.0% | 92.8% |
| Range | 48.6% | 57.4% |
| Mean | 68.4% | 67.3% |
| Median | 67.1% | 67.9% |
| Interquartile 25% (IQ1) | 62.1% | 62.5% |
| Interquartile 75% (IQ3) | 74.7% | 73.0% |
| Interquartile Range (IQR) | 12.7% | 10.5% |
| Standard Deviation (Sample) | 9.3% | 10.5% |
| Standard Deviation (Population) | 9.2% | 10.4% |
Similar Demographics by Family Households
Demographics Similar to Trinidadians and Tobagonians by Family Households
In terms of family households, the demographic groups most similar to Trinidadians and Tobagonians are Immigrants from Bahamas (63.6%, a difference of 0.010%), Immigrants from Hungary (63.6%, a difference of 0.020%), Turkish (63.6%, a difference of 0.030%), Blackfeet (63.6%, a difference of 0.050%), and Bulgarian (63.6%, a difference of 0.070%).
| Demographics | Rating | Rank | Family Households |
| Immigrants | Europe | 6.4 /100 | #220 | Tragic 63.7% |
| Immigrants | South Africa | 5.9 /100 | #221 | Tragic 63.7% |
| Immigrants | Belarus | 5.5 /100 | #222 | Tragic 63.7% |
| French Canadians | 5.4 /100 | #223 | Tragic 63.7% |
| Turks | 4.5 /100 | #224 | Tragic 63.6% |
| Immigrants | Hungary | 4.3 /100 | #225 | Tragic 63.6% |
| Immigrants | Bahamas | 4.2 /100 | #226 | Tragic 63.6% |
| Trinidadians and Tobagonians | 4.1 /100 | #227 | Tragic 63.6% |
| Blackfeet | 3.6 /100 | #228 | Tragic 63.6% |
| Bulgarians | 3.4 /100 | #229 | Tragic 63.6% |
| Immigrants | Brazil | 3.0 /100 | #230 | Tragic 63.6% |
| Immigrants | Greece | 2.9 /100 | #231 | Tragic 63.5% |
| Immigrants | Northern Africa | 2.6 /100 | #232 | Tragic 63.5% |
| Immigrants | Armenia | 2.6 /100 | #233 | Tragic 63.5% |
| Finns | 2.3 /100 | #234 | Tragic 63.5% |
Demographics Similar to Immigrants from Bolivia by Family Households
In terms of family households, the demographic groups most similar to Immigrants from Bolivia are Guamanian/Chamorro (66.6%, a difference of 0.030%), Menominee (66.5%, a difference of 0.060%), Apache (66.5%, a difference of 0.070%), Asian (66.5%, a difference of 0.11%), and Venezuelan (66.5%, a difference of 0.14%).
| Demographics | Rating | Rank | Family Households |
| Thais | 100.0 /100 | #34 | Exceptional 67.2% |
| Tohono O'odham | 100.0 /100 | #35 | Exceptional 67.1% |
| Peruvians | 100.0 /100 | #36 | Exceptional 67.1% |
| Tsimshian | 100.0 /100 | #37 | Exceptional 67.1% |
| Mexican American Indians | 100.0 /100 | #38 | Exceptional 67.0% |
| Immigrants | El Salvador | 100.0 /100 | #39 | Exceptional 67.0% |
| Guamanians/Chamorros | 100.0 /100 | #40 | Exceptional 66.6% |
| Immigrants | Bolivia | 100.0 /100 | #41 | Exceptional 66.6% |
| Menominee | 100.0 /100 | #42 | Exceptional 66.5% |
| Apache | 100.0 /100 | #43 | Exceptional 66.5% |
| Asians | 100.0 /100 | #44 | Exceptional 66.5% |
| Venezuelans | 100.0 /100 | #45 | Exceptional 66.5% |
| Arapaho | 100.0 /100 | #46 | Exceptional 66.5% |
| Bolivians | 100.0 /100 | #47 | Exceptional 66.5% |
| Immigrants | Venezuela | 100.0 /100 | #48 | Exceptional 66.4% |