Hawaiian vs Immigrants from South Central Asia Family Households
COMPARE
Hawaiian
Immigrants from South Central Asia
Family Households
Family Households Comparison
Hawaiians
Immigrants from South Central Asia
67.4%
FAMILY HOUSEHOLDS
100.0/ 100
METRIC RATING
28th/ 347
METRIC RANK
66.4%
FAMILY HOUSEHOLDS
100.0/ 100
METRIC RATING
49th/ 347
METRIC RANK
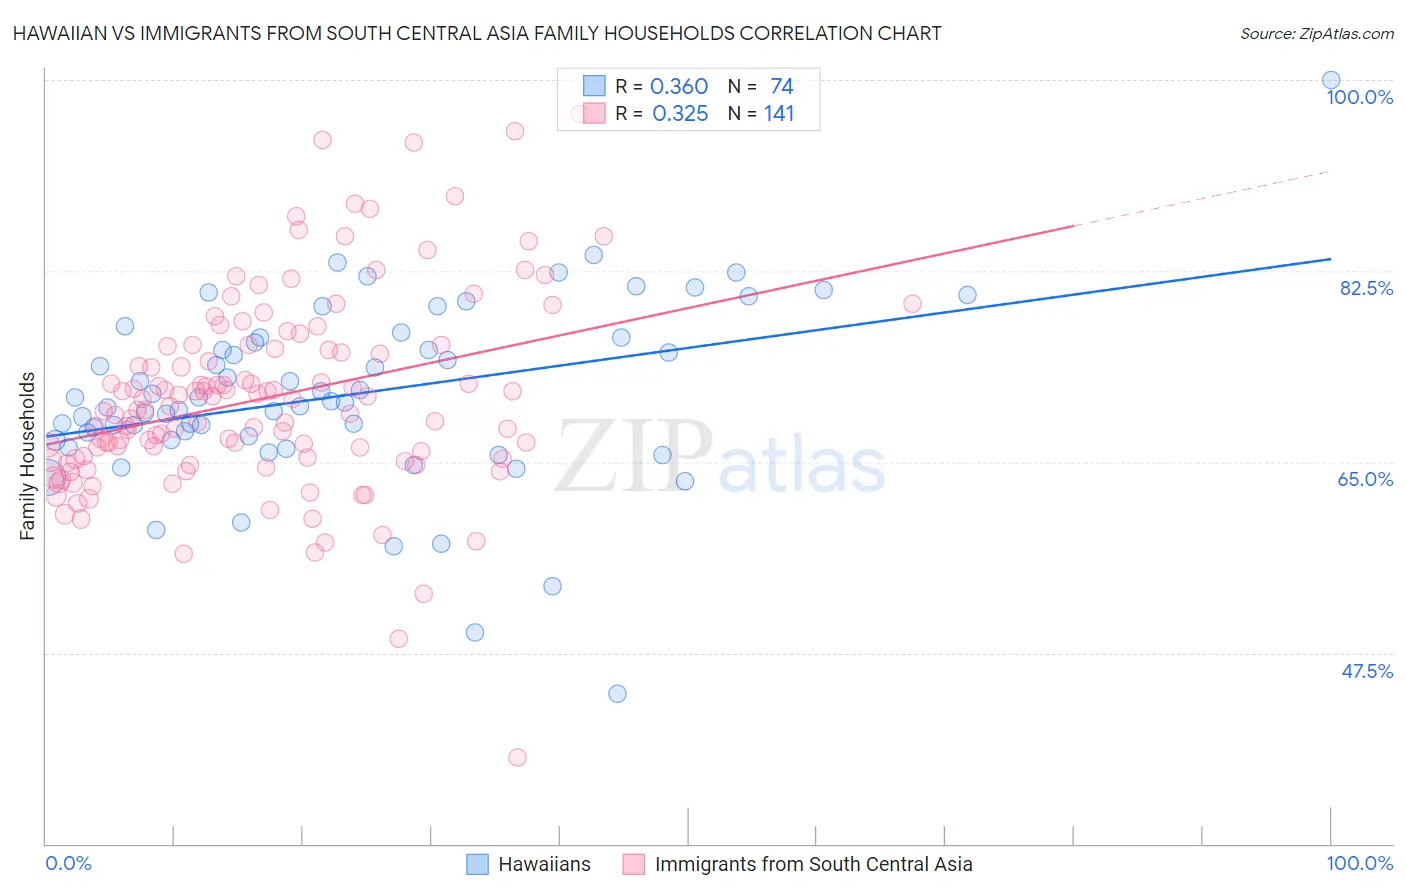
Hawaiian vs Immigrants from South Central Asia Family Households Correlation Chart
The statistical analysis conducted on geographies consisting of 327,392,617 people shows a mild positive correlation between the proportion of Hawaiians and percentage of family households in the United States with a correlation coefficient (R) of 0.360 and weighted average of 67.4%. Similarly, the statistical analysis conducted on geographies consisting of 472,677,474 people shows a mild positive correlation between the proportion of Immigrants from South Central Asia and percentage of family households in the United States with a correlation coefficient (R) of 0.325 and weighted average of 66.4%, a difference of 1.5%.
Family Households Correlation Summary
| Measurement | Hawaiian | Immigrants from South Central Asia |
| Minimum | 43.7% | 37.9% |
| Maximum | 100.0% | 97.0% |
| Range | 56.3% | 59.0% |
| Mean | 71.1% | 70.8% |
| Median | 70.5% | 69.8% |
| Interquartile 25% (IQ1) | 67.0% | 65.3% |
| Interquartile 75% (IQ3) | 76.4% | 75.5% |
| Interquartile Range (IQR) | 9.3% | 10.2% |
| Standard Deviation (Sample) | 8.5% | 9.0% |
| Standard Deviation (Population) | 8.4% | 9.0% |
Similar Demographics by Family Households
Demographics Similar to Hawaiians by Family Households
In terms of family households, the demographic groups most similar to Hawaiians are Hispanic or Latino (67.4%, a difference of 0.010%), Immigrants from India (67.4%, a difference of 0.060%), Immigrants from Nicaragua (67.5%, a difference of 0.070%), Nicaraguan (67.4%, a difference of 0.070%), and Immigrants from South Eastern Asia (67.5%, a difference of 0.090%).
| Demographics | Rating | Rank | Family Households |
| Cubans | 100.0 /100 | #21 | Exceptional 67.7% |
| Sri Lankans | 100.0 /100 | #22 | Exceptional 67.7% |
| Immigrants | Pakistan | 100.0 /100 | #23 | Exceptional 67.7% |
| Immigrants | South Eastern Asia | 100.0 /100 | #24 | Exceptional 67.5% |
| Immigrants | Nicaragua | 100.0 /100 | #25 | Exceptional 67.5% |
| Immigrants | India | 100.0 /100 | #26 | Exceptional 67.4% |
| Hispanics or Latinos | 100.0 /100 | #27 | Exceptional 67.4% |
| Hawaiians | 100.0 /100 | #28 | Exceptional 67.4% |
| Nicaraguans | 100.0 /100 | #29 | Exceptional 67.4% |
| Immigrants | Peru | 100.0 /100 | #30 | Exceptional 67.2% |
| Immigrants | Latin America | 100.0 /100 | #31 | Exceptional 67.2% |
| Nepalese | 100.0 /100 | #32 | Exceptional 67.2% |
| Salvadorans | 100.0 /100 | #33 | Exceptional 67.2% |
| Thais | 100.0 /100 | #34 | Exceptional 67.2% |
| Tohono O'odham | 100.0 /100 | #35 | Exceptional 67.1% |
Demographics Similar to Immigrants from South Central Asia by Family Households
In terms of family households, the demographic groups most similar to Immigrants from South Central Asia are Immigrants from Venezuela (66.4%, a difference of 0.050%), Bolivian (66.5%, a difference of 0.070%), Navajo (66.4%, a difference of 0.070%), Native/Alaskan (66.4%, a difference of 0.090%), and Arapaho (66.5%, a difference of 0.10%).
| Demographics | Rating | Rank | Family Households |
| Menominee | 100.0 /100 | #42 | Exceptional 66.5% |
| Apache | 100.0 /100 | #43 | Exceptional 66.5% |
| Asians | 100.0 /100 | #44 | Exceptional 66.5% |
| Venezuelans | 100.0 /100 | #45 | Exceptional 66.5% |
| Arapaho | 100.0 /100 | #46 | Exceptional 66.5% |
| Bolivians | 100.0 /100 | #47 | Exceptional 66.5% |
| Immigrants | Venezuela | 100.0 /100 | #48 | Exceptional 66.4% |
| Immigrants | South Central Asia | 100.0 /100 | #49 | Exceptional 66.4% |
| Navajo | 100.0 /100 | #50 | Exceptional 66.4% |
| Natives/Alaskans | 100.0 /100 | #51 | Exceptional 66.4% |
| Colombians | 100.0 /100 | #52 | Exceptional 66.3% |
| Afghans | 100.0 /100 | #53 | Exceptional 66.3% |
| Immigrants | Colombia | 100.0 /100 | #54 | Exceptional 66.3% |
| Immigrants | Immigrants | 100.0 /100 | #55 | Exceptional 66.1% |
| Immigrants | Hong Kong | 100.0 /100 | #56 | Exceptional 66.1% |