Hawaiian vs Spanish American Indian Family Households
COMPARE
Hawaiian
Spanish American Indian
Family Households
Family Households Comparison
Hawaiians
Spanish American Indians
67.4%
FAMILY HOUSEHOLDS
100.0/ 100
METRIC RATING
28th/ 347
METRIC RANK
71.2%
FAMILY HOUSEHOLDS
100.0/ 100
METRIC RATING
2nd/ 347
METRIC RANK
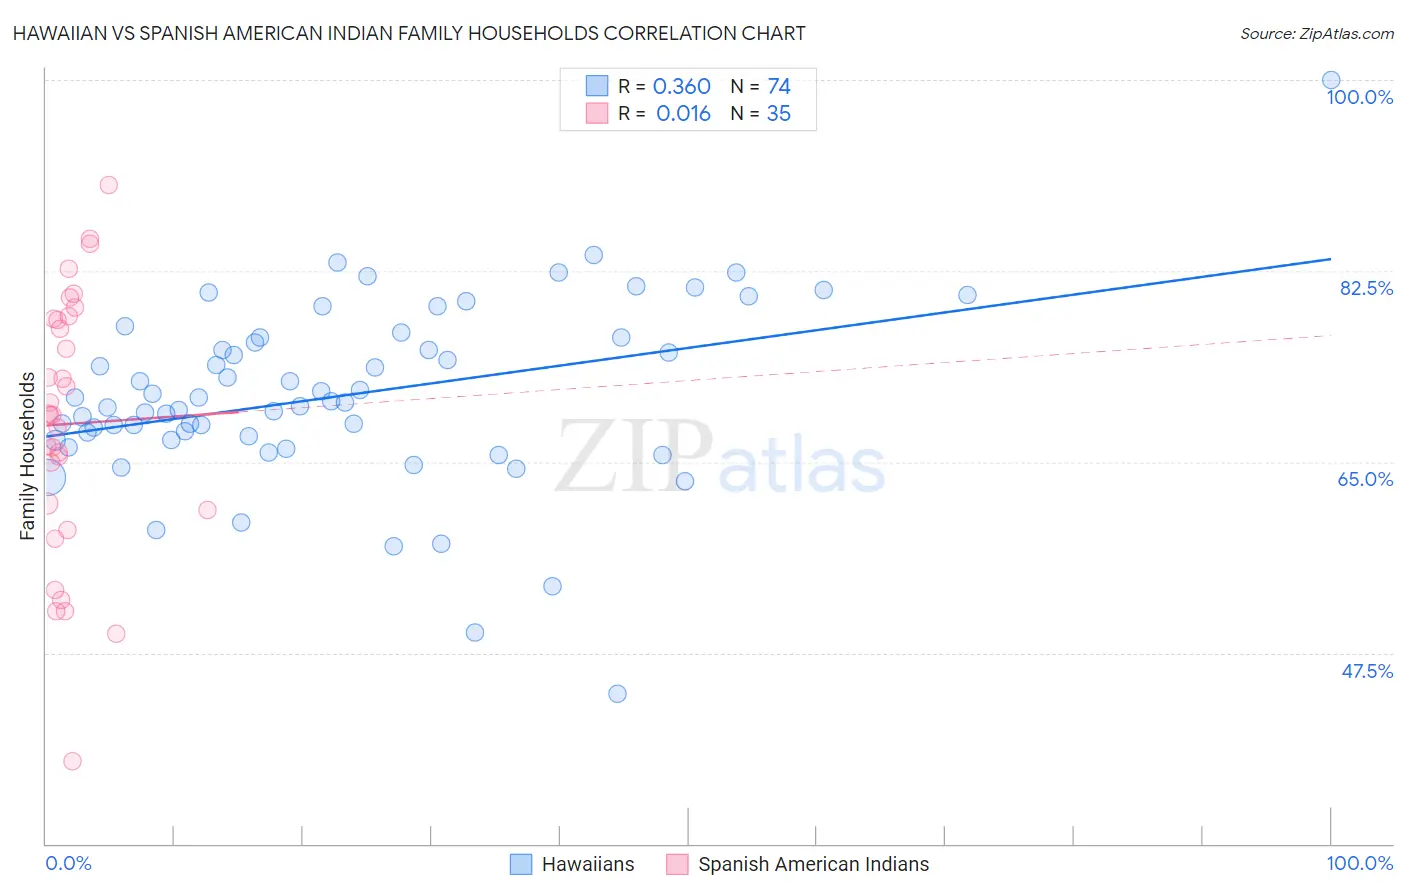
Hawaiian vs Spanish American Indian Family Households Correlation Chart
The statistical analysis conducted on geographies consisting of 327,392,617 people shows a mild positive correlation between the proportion of Hawaiians and percentage of family households in the United States with a correlation coefficient (R) of 0.360 and weighted average of 67.4%. Similarly, the statistical analysis conducted on geographies consisting of 73,145,550 people shows no correlation between the proportion of Spanish American Indians and percentage of family households in the United States with a correlation coefficient (R) of 0.016 and weighted average of 71.2%, a difference of 5.6%.
Family Households Correlation Summary
| Measurement | Hawaiian | Spanish American Indian |
| Minimum | 43.7% | 37.6% |
| Maximum | 100.0% | 90.4% |
| Range | 56.3% | 52.8% |
| Mean | 71.1% | 68.5% |
| Median | 70.5% | 69.3% |
| Interquartile 25% (IQ1) | 67.0% | 60.6% |
| Interquartile 75% (IQ3) | 76.4% | 78.1% |
| Interquartile Range (IQR) | 9.3% | 17.5% |
| Standard Deviation (Sample) | 8.5% | 11.9% |
| Standard Deviation (Population) | 8.4% | 11.8% |
Similar Demographics by Family Households
Demographics Similar to Hawaiians by Family Households
In terms of family households, the demographic groups most similar to Hawaiians are Hispanic or Latino (67.4%, a difference of 0.010%), Immigrants from India (67.4%, a difference of 0.060%), Immigrants from Nicaragua (67.5%, a difference of 0.070%), Nicaraguan (67.4%, a difference of 0.070%), and Immigrants from South Eastern Asia (67.5%, a difference of 0.090%).
| Demographics | Rating | Rank | Family Households |
| Cubans | 100.0 /100 | #21 | Exceptional 67.7% |
| Sri Lankans | 100.0 /100 | #22 | Exceptional 67.7% |
| Immigrants | Pakistan | 100.0 /100 | #23 | Exceptional 67.7% |
| Immigrants | South Eastern Asia | 100.0 /100 | #24 | Exceptional 67.5% |
| Immigrants | Nicaragua | 100.0 /100 | #25 | Exceptional 67.5% |
| Immigrants | India | 100.0 /100 | #26 | Exceptional 67.4% |
| Hispanics or Latinos | 100.0 /100 | #27 | Exceptional 67.4% |
| Hawaiians | 100.0 /100 | #28 | Exceptional 67.4% |
| Nicaraguans | 100.0 /100 | #29 | Exceptional 67.4% |
| Immigrants | Peru | 100.0 /100 | #30 | Exceptional 67.2% |
| Immigrants | Latin America | 100.0 /100 | #31 | Exceptional 67.2% |
| Nepalese | 100.0 /100 | #32 | Exceptional 67.2% |
| Salvadorans | 100.0 /100 | #33 | Exceptional 67.2% |
| Thais | 100.0 /100 | #34 | Exceptional 67.2% |
| Tohono O'odham | 100.0 /100 | #35 | Exceptional 67.1% |
Demographics Similar to Spanish American Indians by Family Households
In terms of family households, the demographic groups most similar to Spanish American Indians are Yup'ik (72.4%, a difference of 1.8%), Tongan (69.6%, a difference of 2.2%), Yakama (69.3%, a difference of 2.7%), Yuman (69.3%, a difference of 2.7%), and Immigrants from Mexico (69.1%, a difference of 2.9%).
| Demographics | Rating | Rank | Family Households |
| Yup'ik | 100 /100 | #1 | Exceptional 72.4% |
| Spanish American Indians | 100.0 /100 | #2 | Exceptional 71.2% |
| Tongans | 100.0 /100 | #3 | Exceptional 69.6% |
| Yakama | 100.0 /100 | #4 | Exceptional 69.3% |
| Yuman | 100.0 /100 | #5 | Exceptional 69.3% |
| Immigrants | Mexico | 100.0 /100 | #6 | Exceptional 69.1% |
| Mexicans | 100.0 /100 | #7 | Exceptional 69.0% |
| Immigrants | Fiji | 100.0 /100 | #8 | Exceptional 68.8% |
| Native Hawaiians | 100.0 /100 | #9 | Exceptional 68.4% |
| Immigrants | Philippines | 100.0 /100 | #10 | Exceptional 68.3% |
| Immigrants | Central America | 100.0 /100 | #11 | Exceptional 68.3% |
| Koreans | 100.0 /100 | #12 | Exceptional 68.3% |
| Pueblo | 100.0 /100 | #13 | Exceptional 68.2% |
| Immigrants | Cuba | 100.0 /100 | #14 | Exceptional 68.2% |
| Assyrians/Chaldeans/Syriacs | 100.0 /100 | #15 | Exceptional 68.2% |