Haitian vs South American Indian 3rd Grade
COMPARE
Haitian
South American Indian
3rd Grade
3rd Grade Comparison
Haitians
South American Indians
96.9%
3RD GRADE
0.0/ 100
METRIC RATING
297th/ 347
METRIC RANK
97.5%
3RD GRADE
5.7/ 100
METRIC RATING
217th/ 347
METRIC RANK
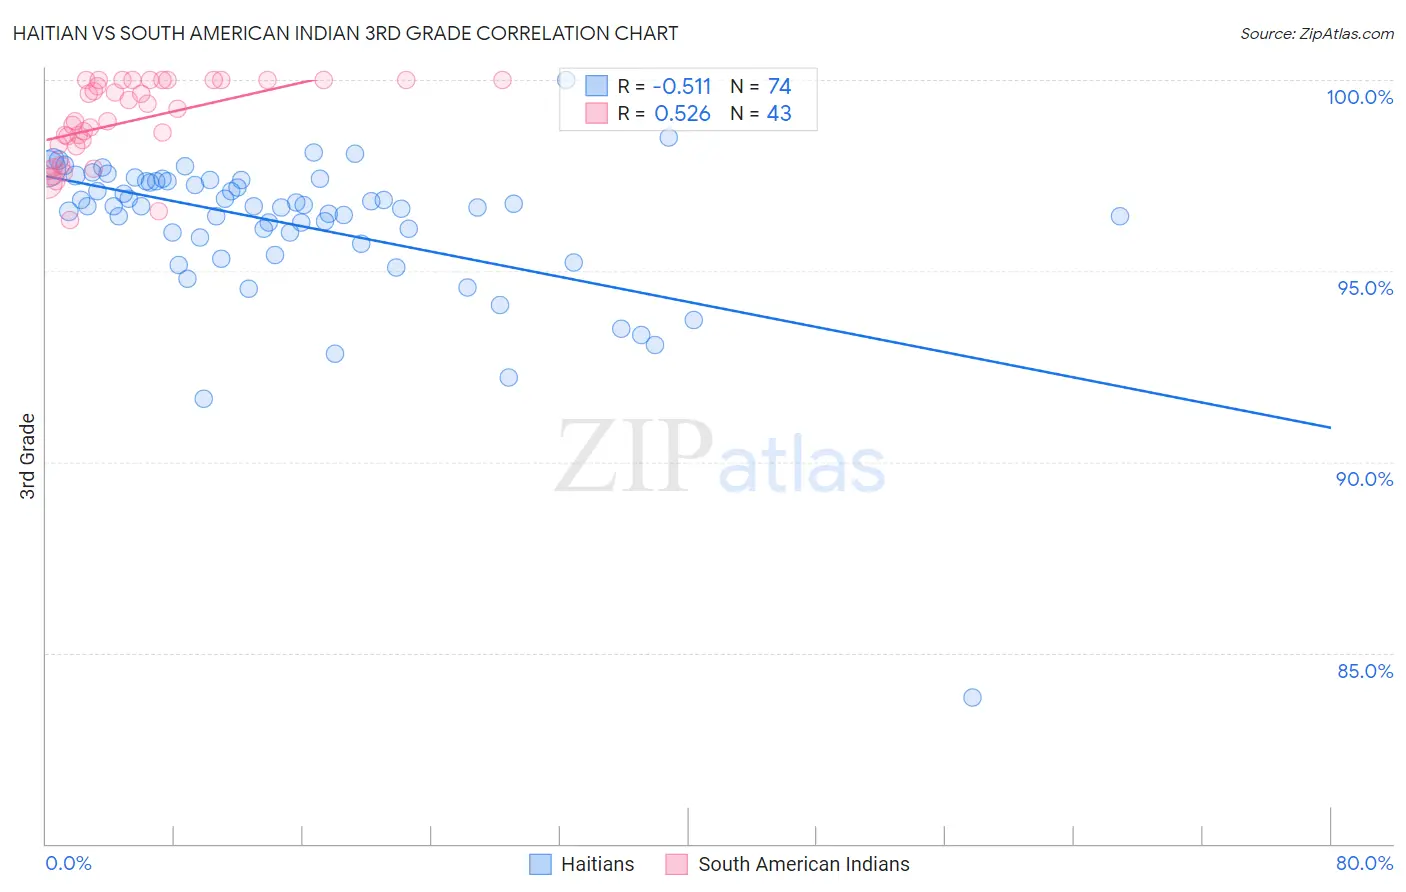
Haitian vs South American Indian 3rd Grade Correlation Chart
The statistical analysis conducted on geographies consisting of 288,018,742 people shows a substantial negative correlation between the proportion of Haitians and percentage of population with at least 3rd grade education in the United States with a correlation coefficient (R) of -0.511 and weighted average of 96.9%. Similarly, the statistical analysis conducted on geographies consisting of 164,573,401 people shows a substantial positive correlation between the proportion of South American Indians and percentage of population with at least 3rd grade education in the United States with a correlation coefficient (R) of 0.526 and weighted average of 97.5%, a difference of 0.69%.
3rd Grade Correlation Summary
| Measurement | Haitian | South American Indian |
| Minimum | 83.8% | 96.3% |
| Maximum | 100.0% | 100.0% |
| Range | 16.2% | 3.7% |
| Mean | 96.2% | 98.9% |
| Median | 96.7% | 98.9% |
| Interquartile 25% (IQ1) | 95.9% | 98.3% |
| Interquartile 75% (IQ3) | 97.4% | 100.0% |
| Interquartile Range (IQR) | 1.5% | 1.7% |
| Standard Deviation (Sample) | 2.1% | 1.1% |
| Standard Deviation (Population) | 2.1% | 1.1% |
Similar Demographics by 3rd Grade
Demographics Similar to Haitians by 3rd Grade
In terms of 3rd grade, the demographic groups most similar to Haitians are Immigrants from Dominica (96.9%, a difference of 0.0%), Immigrants (96.9%, a difference of 0.020%), Somali (96.8%, a difference of 0.020%), Immigrants from South Eastern Asia (96.8%, a difference of 0.020%), and Immigrants from Cuba (96.8%, a difference of 0.030%).
| Demographics | Rating | Rank | 3rd Grade |
| Immigrants | Portugal | 0.0 /100 | #290 | Tragic 97.0% |
| Immigrants | Afghanistan | 0.0 /100 | #291 | Tragic 97.0% |
| British West Indians | 0.0 /100 | #292 | Tragic 97.0% |
| Immigrants | Grenada | 0.0 /100 | #293 | Tragic 97.0% |
| Malaysians | 0.0 /100 | #294 | Tragic 97.0% |
| Immigrants | Eritrea | 0.0 /100 | #295 | Tragic 97.0% |
| Immigrants | Immigrants | 0.0 /100 | #296 | Tragic 96.9% |
| Haitians | 0.0 /100 | #297 | Tragic 96.9% |
| Immigrants | Dominica | 0.0 /100 | #298 | Tragic 96.9% |
| Somalis | 0.0 /100 | #299 | Tragic 96.8% |
| Immigrants | South Eastern Asia | 0.0 /100 | #300 | Tragic 96.8% |
| Immigrants | Cuba | 0.0 /100 | #301 | Tragic 96.8% |
| Immigrants | Somalia | 0.0 /100 | #302 | Tragic 96.8% |
| Ecuadorians | 0.0 /100 | #303 | Tragic 96.7% |
| Immigrants | Caribbean | 0.0 /100 | #304 | Tragic 96.7% |
Demographics Similar to South American Indians by 3rd Grade
In terms of 3rd grade, the demographic groups most similar to South American Indians are Immigrants from Nepal (97.5%, a difference of 0.010%), Immigrants from Panama (97.5%, a difference of 0.010%), Immigrants from Morocco (97.5%, a difference of 0.010%), Uruguayan (97.5%, a difference of 0.010%), and Iraqi (97.5%, a difference of 0.020%).
| Demographics | Rating | Rank | 3rd Grade |
| Immigrants | Oceania | 9.5 /100 | #210 | Tragic 97.6% |
| Laotians | 9.4 /100 | #211 | Tragic 97.6% |
| Immigrants | Bahamas | 8.5 /100 | #212 | Tragic 97.6% |
| Moroccans | 8.5 /100 | #213 | Tragic 97.6% |
| Yuman | 8.4 /100 | #214 | Tragic 97.6% |
| Iraqis | 6.9 /100 | #215 | Tragic 97.5% |
| Samoans | 6.9 /100 | #216 | Tragic 97.5% |
| South American Indians | 5.7 /100 | #217 | Tragic 97.5% |
| Immigrants | Nepal | 5.3 /100 | #218 | Tragic 97.5% |
| Immigrants | Panama | 5.2 /100 | #219 | Tragic 97.5% |
| Immigrants | Morocco | 5.0 /100 | #220 | Tragic 97.5% |
| Uruguayans | 5.0 /100 | #221 | Tragic 97.5% |
| Sierra Leoneans | 4.6 /100 | #222 | Tragic 97.5% |
| Immigrants | Syria | 4.4 /100 | #223 | Tragic 97.5% |
| Bahamians | 4.4 /100 | #224 | Tragic 97.5% |