Guyanese vs Estonian Divorced or Separated
COMPARE
Guyanese
Estonian
Divorced or Separated
Divorced or Separated Comparison
Guyanese
Estonians
11.5%
DIVORCED OR SEPARATED
99.4/ 100
METRIC RATING
79th/ 347
METRIC RANK
11.7%
DIVORCED OR SEPARATED
96.6/ 100
METRIC RATING
113th/ 347
METRIC RANK
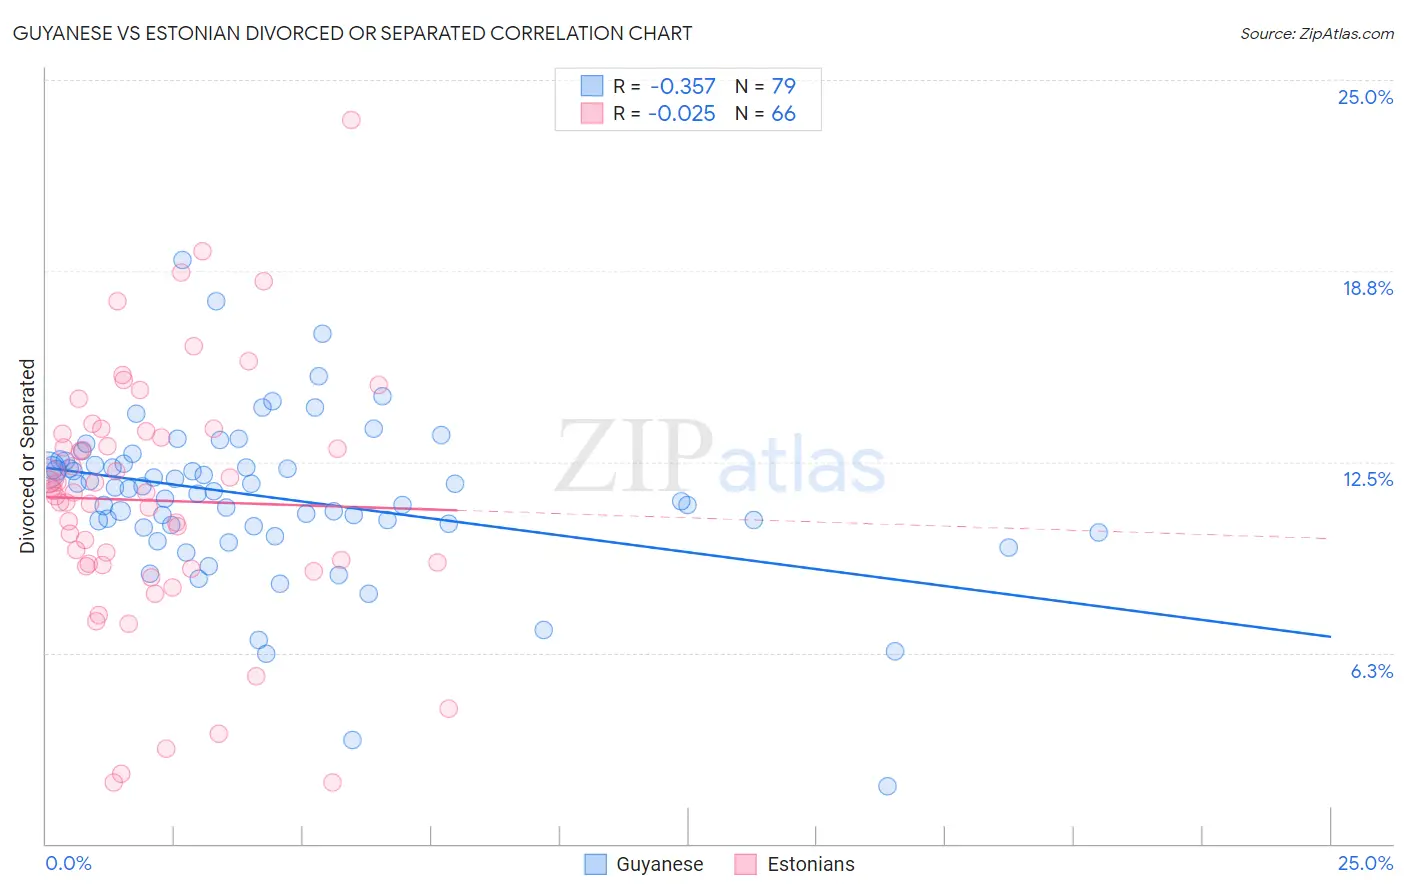
Guyanese vs Estonian Divorced or Separated Correlation Chart
The statistical analysis conducted on geographies consisting of 176,825,728 people shows a mild negative correlation between the proportion of Guyanese and percentage of population currently divorced or separated in the United States with a correlation coefficient (R) of -0.357 and weighted average of 11.5%. Similarly, the statistical analysis conducted on geographies consisting of 123,504,002 people shows no correlation between the proportion of Estonians and percentage of population currently divorced or separated in the United States with a correlation coefficient (R) of -0.025 and weighted average of 11.7%, a difference of 1.6%.
Divorced or Separated Correlation Summary
| Measurement | Guyanese | Estonian |
| Minimum | 1.9% | 2.0% |
| Maximum | 19.1% | 23.7% |
| Range | 17.2% | 21.7% |
| Mean | 11.3% | 11.2% |
| Median | 11.6% | 11.5% |
| Interquartile 25% (IQ1) | 10.4% | 9.1% |
| Interquartile 75% (IQ3) | 12.5% | 13.4% |
| Interquartile Range (IQR) | 2.1% | 4.3% |
| Standard Deviation (Sample) | 2.6% | 4.1% |
| Standard Deviation (Population) | 2.6% | 4.1% |
Similar Demographics by Divorced or Separated
Demographics Similar to Guyanese by Divorced or Separated
In terms of divorced or separated, the demographic groups most similar to Guyanese are Immigrants from Switzerland (11.5%, a difference of 0.020%), Russian (11.5%, a difference of 0.030%), Afghan (11.5%, a difference of 0.040%), Immigrants from Romania (11.5%, a difference of 0.11%), and Immigrants from Italy (11.5%, a difference of 0.14%).
| Demographics | Rating | Rank | Divorced or Separated |
| Jordanians | 99.6 /100 | #72 | Exceptional 11.5% |
| Immigrants | North Macedonia | 99.6 /100 | #73 | Exceptional 11.5% |
| Taiwanese | 99.6 /100 | #74 | Exceptional 11.5% |
| Immigrants | Northern Africa | 99.6 /100 | #75 | Exceptional 11.5% |
| Albanians | 99.6 /100 | #76 | Exceptional 11.5% |
| Immigrants | Italy | 99.5 /100 | #77 | Exceptional 11.5% |
| Afghans | 99.4 /100 | #78 | Exceptional 11.5% |
| Guyanese | 99.4 /100 | #79 | Exceptional 11.5% |
| Immigrants | Switzerland | 99.4 /100 | #80 | Exceptional 11.5% |
| Russians | 99.4 /100 | #81 | Exceptional 11.5% |
| Immigrants | Romania | 99.3 /100 | #82 | Exceptional 11.5% |
| Immigrants | Bulgaria | 99.3 /100 | #83 | Exceptional 11.5% |
| Bulgarians | 99.3 /100 | #84 | Exceptional 11.5% |
| Immigrants | Albania | 99.3 /100 | #85 | Exceptional 11.5% |
| Immigrants | Latvia | 99.2 /100 | #86 | Exceptional 11.6% |
Demographics Similar to Estonians by Divorced or Separated
In terms of divorced or separated, the demographic groups most similar to Estonians are Immigrants from France (11.7%, a difference of 0.0%), Immigrants from Spain (11.7%, a difference of 0.050%), Immigrants from South Africa (11.7%, a difference of 0.090%), Immigrants from Czechoslovakia (11.7%, a difference of 0.090%), and Greek (11.7%, a difference of 0.10%).
| Demographics | Rating | Rank | Divorced or Separated |
| Immigrants | Kazakhstan | 97.8 /100 | #106 | Exceptional 11.7% |
| Native Hawaiians | 97.2 /100 | #107 | Exceptional 11.7% |
| Greeks | 96.9 /100 | #108 | Exceptional 11.7% |
| Immigrants | South Africa | 96.9 /100 | #109 | Exceptional 11.7% |
| Immigrants | Czechoslovakia | 96.9 /100 | #110 | Exceptional 11.7% |
| Immigrants | Spain | 96.8 /100 | #111 | Exceptional 11.7% |
| Immigrants | France | 96.6 /100 | #112 | Exceptional 11.7% |
| Estonians | 96.6 /100 | #113 | Exceptional 11.7% |
| Immigrants | Norway | 95.9 /100 | #114 | Exceptional 11.7% |
| Lithuanians | 95.7 /100 | #115 | Exceptional 11.7% |
| Immigrants | Iraq | 95.4 /100 | #116 | Exceptional 11.7% |
| Immigrants | Uganda | 95.3 /100 | #117 | Exceptional 11.7% |
| Ecuadorians | 95.3 /100 | #118 | Exceptional 11.7% |
| Syrians | 95.1 /100 | #119 | Exceptional 11.7% |
| Iraqis | 94.6 /100 | #120 | Exceptional 11.8% |