Guyanese vs Zimbabwean Male Unemployment
COMPARE
Guyanese
Zimbabwean
Male Unemployment
Male Unemployment Comparison
Guyanese
Zimbabweans
7.1%
MALE UNEMPLOYMENT
0.0/ 100
METRIC RATING
317th/ 347
METRIC RANK
4.8%
MALE UNEMPLOYMENT
99.9/ 100
METRIC RATING
25th/ 347
METRIC RANK
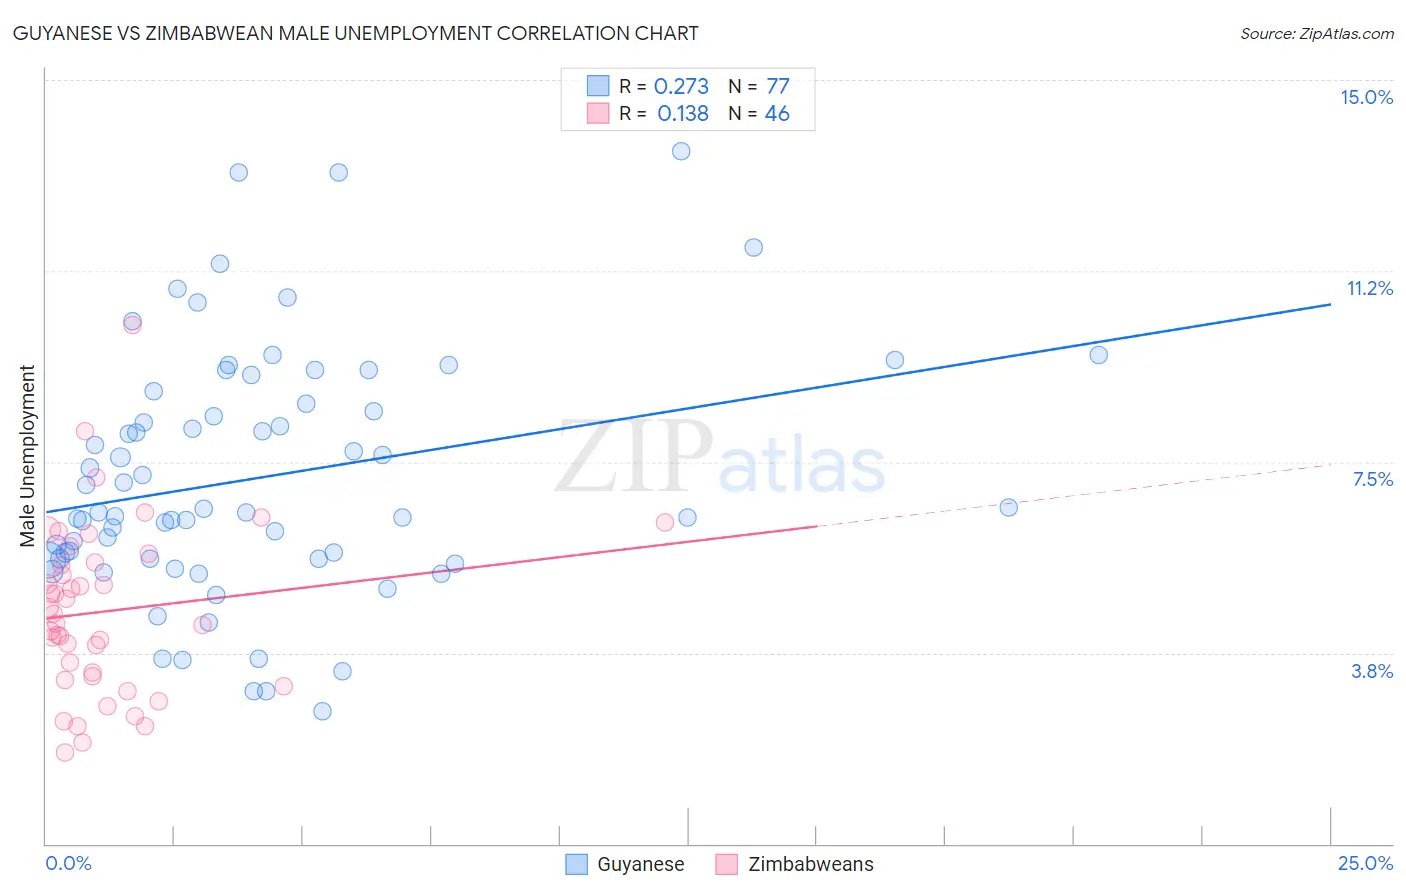
Guyanese vs Zimbabwean Male Unemployment Correlation Chart
The statistical analysis conducted on geographies consisting of 176,637,764 people shows a weak positive correlation between the proportion of Guyanese and unemployment rate among males in the United States with a correlation coefficient (R) of 0.273 and weighted average of 7.1%. Similarly, the statistical analysis conducted on geographies consisting of 69,161,381 people shows a poor positive correlation between the proportion of Zimbabweans and unemployment rate among males in the United States with a correlation coefficient (R) of 0.138 and weighted average of 4.8%, a difference of 48.9%.
Male Unemployment Correlation Summary
| Measurement | Guyanese | Zimbabwean |
| Minimum | 2.6% | 1.8% |
| Maximum | 13.6% | 10.2% |
| Range | 11.0% | 8.4% |
| Mean | 7.2% | 4.6% |
| Median | 6.5% | 4.4% |
| Interquartile 25% (IQ1) | 5.6% | 3.3% |
| Interquartile 75% (IQ3) | 8.8% | 5.5% |
| Interquartile Range (IQR) | 3.2% | 2.2% |
| Standard Deviation (Sample) | 2.4% | 1.7% |
| Standard Deviation (Population) | 2.4% | 1.7% |
Similar Demographics by Male Unemployment
Demographics Similar to Guyanese by Male Unemployment
In terms of male unemployment, the demographic groups most similar to Guyanese are Immigrants from Guyana (7.1%, a difference of 0.060%), Cape Verdean (7.1%, a difference of 0.070%), Houma (7.1%, a difference of 0.080%), Immigrants from Barbados (7.1%, a difference of 0.30%), and Immigrants from Dominica (7.0%, a difference of 1.6%).
| Demographics | Rating | Rank | Male Unemployment |
| Blacks/African Americans | 0.0 /100 | #310 | Tragic 6.9% |
| Immigrants | Armenia | 0.0 /100 | #311 | Tragic 6.9% |
| Lumbee | 0.0 /100 | #312 | Tragic 6.9% |
| Immigrants | Dominica | 0.0 /100 | #313 | Tragic 7.0% |
| Immigrants | Barbados | 0.0 /100 | #314 | Tragic 7.1% |
| Houma | 0.0 /100 | #315 | Tragic 7.1% |
| Immigrants | Guyana | 0.0 /100 | #316 | Tragic 7.1% |
| Guyanese | 0.0 /100 | #317 | Tragic 7.1% |
| Cape Verdeans | 0.0 /100 | #318 | Tragic 7.1% |
| British West Indians | 0.0 /100 | #319 | Tragic 7.3% |
| Colville | 0.0 /100 | #320 | Tragic 7.4% |
| Immigrants | St. Vincent and the Grenadines | 0.0 /100 | #321 | Tragic 7.5% |
| Immigrants | Cabo Verde | 0.0 /100 | #322 | Tragic 7.5% |
| Immigrants | Grenada | 0.0 /100 | #323 | Tragic 7.6% |
| Dominicans | 0.0 /100 | #324 | Tragic 7.6% |
Demographics Similar to Zimbabweans by Male Unemployment
In terms of male unemployment, the demographic groups most similar to Zimbabweans are Dutch (4.8%, a difference of 0.020%), Immigrants from South Central Asia (4.8%, a difference of 0.10%), Tongan (4.8%, a difference of 0.13%), Carpatho Rusyn (4.8%, a difference of 0.18%), and Immigrants from Taiwan (4.8%, a difference of 0.19%).
| Demographics | Rating | Rank | Male Unemployment |
| English | 99.9 /100 | #18 | Exceptional 4.8% |
| Europeans | 99.9 /100 | #19 | Exceptional 4.8% |
| Pennsylvania Germans | 99.9 /100 | #20 | Exceptional 4.8% |
| Immigrants | Taiwan | 99.9 /100 | #21 | Exceptional 4.8% |
| Carpatho Rusyns | 99.9 /100 | #22 | Exceptional 4.8% |
| Tongans | 99.9 /100 | #23 | Exceptional 4.8% |
| Immigrants | South Central Asia | 99.9 /100 | #24 | Exceptional 4.8% |
| Zimbabweans | 99.9 /100 | #25 | Exceptional 4.8% |
| Dutch | 99.9 /100 | #26 | Exceptional 4.8% |
| Belgians | 99.9 /100 | #27 | Exceptional 4.8% |
| Bulgarians | 99.8 /100 | #28 | Exceptional 4.8% |
| Scottish | 99.8 /100 | #29 | Exceptional 4.8% |
| British | 99.8 /100 | #30 | Exceptional 4.8% |
| Sudanese | 99.8 /100 | #31 | Exceptional 4.8% |
| Immigrants | Nepal | 99.8 /100 | #32 | Exceptional 4.8% |