Guyanese vs Subsaharan African Average Family Size
COMPARE
Guyanese
Subsaharan African
Average Family Size
Average Family Size Comparison
Guyanese
Sub-Saharan Africans
3.40
AVERAGE FAMILY SIZE
100.0/ 100
METRIC RATING
37th/ 347
METRIC RANK
3.25
AVERAGE FAMILY SIZE
81.6/ 100
METRIC RATING
140th/ 347
METRIC RANK
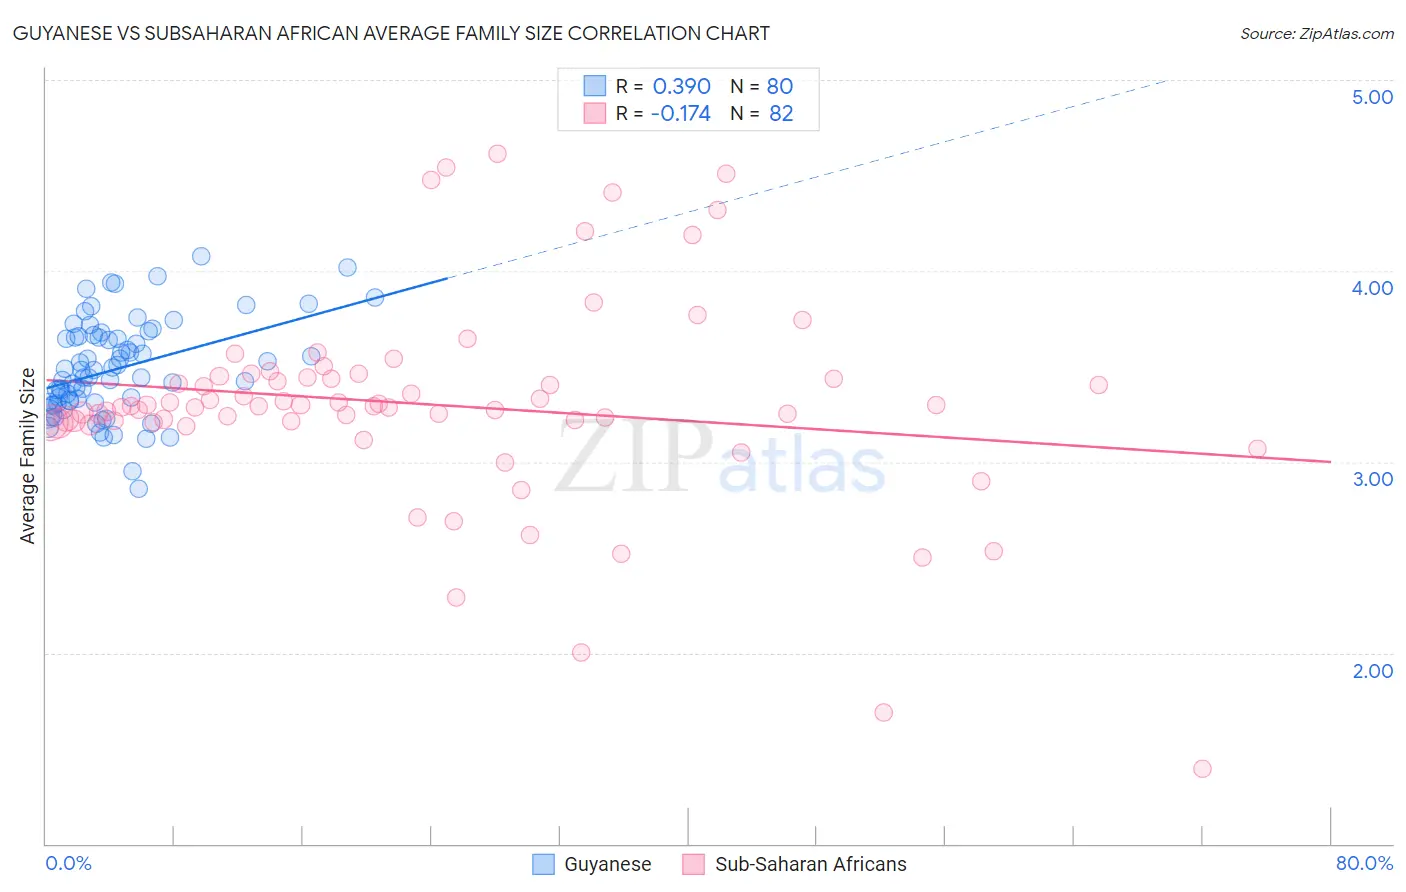
Guyanese vs Subsaharan African Average Family Size Correlation Chart
The statistical analysis conducted on geographies consisting of 176,801,738 people shows a mild positive correlation between the proportion of Guyanese and average family size in the United States with a correlation coefficient (R) of 0.390 and weighted average of 3.40. Similarly, the statistical analysis conducted on geographies consisting of 507,604,346 people shows a poor negative correlation between the proportion of Sub-Saharan Africans and average family size in the United States with a correlation coefficient (R) of -0.174 and weighted average of 3.25, a difference of 4.6%.
Average Family Size Correlation Summary
| Measurement | Guyanese | Subsaharan African |
| Minimum | 2.86 | 1.39 |
| Maximum | 4.08 | 4.61 |
| Range | 1.22 | 3.22 |
| Mean | 3.49 | 3.30 |
| Median | 3.46 | 3.29 |
| Interquartile 25% (IQ1) | 3.31 | 3.21 |
| Interquartile 75% (IQ3) | 3.65 | 3.44 |
| Interquartile Range (IQR) | 0.34 | 0.23 |
| Standard Deviation (Sample) | 0.25 | 0.54 |
| Standard Deviation (Population) | 0.25 | 0.54 |
Similar Demographics by Average Family Size
Demographics Similar to Guyanese by Average Family Size
In terms of average family size, the demographic groups most similar to Guyanese are Immigrants from Guyana (3.40, a difference of 0.14%), Immigrants from Belize (3.39, a difference of 0.16%), Guatemalan (3.40, a difference of 0.19%), Immigrants from Haiti (3.39, a difference of 0.24%), and Hispanic or Latino (3.41, a difference of 0.25%).
| Demographics | Rating | Rank | Average Family Size |
| Samoans | 100.0 /100 | #30 | Exceptional 3.42 |
| Central Americans | 100.0 /100 | #31 | Exceptional 3.41 |
| Immigrants | Guatemala | 100.0 /100 | #32 | Exceptional 3.41 |
| Hawaiians | 100.0 /100 | #33 | Exceptional 3.41 |
| Hispanics or Latinos | 100.0 /100 | #34 | Exceptional 3.41 |
| Guatemalans | 100.0 /100 | #35 | Exceptional 3.40 |
| Immigrants | Guyana | 100.0 /100 | #36 | Exceptional 3.40 |
| Guyanese | 100.0 /100 | #37 | Exceptional 3.40 |
| Immigrants | Belize | 100.0 /100 | #38 | Exceptional 3.39 |
| Immigrants | Haiti | 100.0 /100 | #39 | Exceptional 3.39 |
| Belizeans | 100.0 /100 | #40 | Exceptional 3.39 |
| Marshallese | 100.0 /100 | #41 | Exceptional 3.38 |
| Immigrants | Vietnam | 100.0 /100 | #42 | Exceptional 3.38 |
| Immigrants | Philippines | 100.0 /100 | #43 | Exceptional 3.37 |
| Alaska Natives | 100.0 /100 | #44 | Exceptional 3.37 |
Demographics Similar to Sub-Saharan Africans by Average Family Size
In terms of average family size, the demographic groups most similar to Sub-Saharan Africans are Immigrants from Ethiopia (3.25, a difference of 0.0%), Venezuelan (3.25, a difference of 0.0%), Cuban (3.25, a difference of 0.010%), Liberian (3.25, a difference of 0.010%), and Immigrants from Middle Africa (3.25, a difference of 0.020%).
| Demographics | Rating | Rank | Average Family Size |
| Immigrants | Venezuela | 86.3 /100 | #133 | Excellent 3.26 |
| Africans | 84.9 /100 | #134 | Excellent 3.25 |
| Panamanians | 84.2 /100 | #135 | Excellent 3.25 |
| Comanche | 82.8 /100 | #136 | Excellent 3.25 |
| Immigrants | Middle Africa | 82.4 /100 | #137 | Excellent 3.25 |
| Cubans | 81.8 /100 | #138 | Excellent 3.25 |
| Immigrants | Ethiopia | 81.6 /100 | #139 | Excellent 3.25 |
| Sub-Saharan Africans | 81.6 /100 | #140 | Excellent 3.25 |
| Venezuelans | 81.4 /100 | #141 | Excellent 3.25 |
| Liberians | 81.2 /100 | #142 | Excellent 3.25 |
| Bhutanese | 81.0 /100 | #143 | Excellent 3.25 |
| Tsimshian | 80.2 /100 | #144 | Excellent 3.25 |
| Armenians | 78.2 /100 | #145 | Good 3.25 |
| Immigrants | Africa | 77.9 /100 | #146 | Good 3.25 |
| Immigrants | Jordan | 75.7 /100 | #147 | Good 3.24 |