Pueblo vs Subsaharan African Average Family Size
COMPARE
Pueblo
Subsaharan African
Average Family Size
Average Family Size Comparison
Pueblo
Sub-Saharan Africans
3.79
AVERAGE FAMILY SIZE
100/ 100
METRIC RATING
3rd/ 347
METRIC RANK
3.25
AVERAGE FAMILY SIZE
81.6/ 100
METRIC RATING
140th/ 347
METRIC RANK
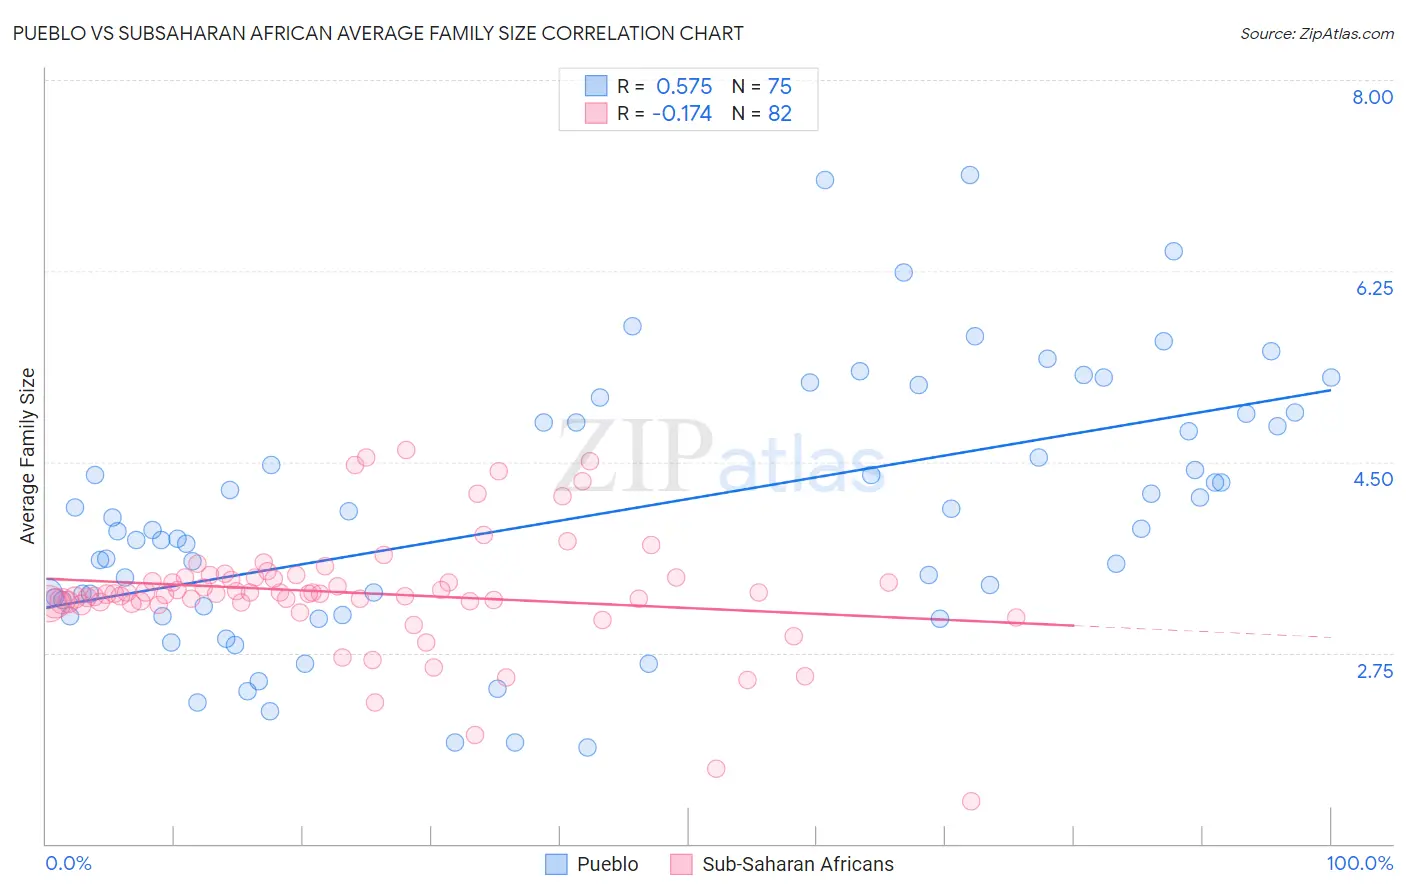
Pueblo vs Subsaharan African Average Family Size Correlation Chart
The statistical analysis conducted on geographies consisting of 120,067,636 people shows a substantial positive correlation between the proportion of Pueblo and average family size in the United States with a correlation coefficient (R) of 0.575 and weighted average of 3.79. Similarly, the statistical analysis conducted on geographies consisting of 507,604,346 people shows a poor negative correlation between the proportion of Sub-Saharan Africans and average family size in the United States with a correlation coefficient (R) of -0.174 and weighted average of 3.25, a difference of 16.7%.
Average Family Size Correlation Summary
| Measurement | Pueblo | Subsaharan African |
| Minimum | 1.88 | 1.39 |
| Maximum | 7.13 | 4.61 |
| Range | 5.25 | 3.22 |
| Mean | 4.02 | 3.30 |
| Median | 3.88 | 3.29 |
| Interquartile 25% (IQ1) | 3.17 | 3.21 |
| Interquartile 75% (IQ3) | 4.86 | 3.44 |
| Interquartile Range (IQR) | 1.69 | 0.23 |
| Standard Deviation (Sample) | 1.18 | 0.54 |
| Standard Deviation (Population) | 1.18 | 0.54 |
Similar Demographics by Average Family Size
Demographics Similar to Pueblo by Average Family Size
In terms of average family size, the demographic groups most similar to Pueblo are Crow (3.82, a difference of 0.81%), Pima (3.75, a difference of 1.3%), Navajo (3.65, a difference of 4.1%), Arapaho (3.64, a difference of 4.4%), and Inupiat (3.63, a difference of 4.6%).
| Demographics | Rating | Rank | Average Family Size |
| Yup'ik | 100 /100 | #1 | Exceptional 4.00 |
| Crow | 100 /100 | #2 | Exceptional 3.82 |
| Pueblo | 100 /100 | #3 | Exceptional 3.79 |
| Pima | 100 /100 | #4 | Exceptional 3.75 |
| Navajo | 100.0 /100 | #5 | Exceptional 3.65 |
| Arapaho | 100.0 /100 | #6 | Exceptional 3.64 |
| Inupiat | 100.0 /100 | #7 | Exceptional 3.63 |
| Immigrants | Yemen | 100.0 /100 | #8 | Exceptional 3.60 |
| Hopi | 100.0 /100 | #9 | Exceptional 3.60 |
| Spanish American Indians | 100.0 /100 | #10 | Exceptional 3.58 |
| Tohono O'odham | 100.0 /100 | #11 | Exceptional 3.53 |
| Immigrants | Mexico | 100.0 /100 | #12 | Exceptional 3.52 |
| Sioux | 100.0 /100 | #13 | Exceptional 3.52 |
| Immigrants | Central America | 100.0 /100 | #14 | Exceptional 3.49 |
| Tongans | 100.0 /100 | #15 | Exceptional 3.49 |
Demographics Similar to Sub-Saharan Africans by Average Family Size
In terms of average family size, the demographic groups most similar to Sub-Saharan Africans are Immigrants from Ethiopia (3.25, a difference of 0.0%), Venezuelan (3.25, a difference of 0.0%), Cuban (3.25, a difference of 0.010%), Liberian (3.25, a difference of 0.010%), and Immigrants from Middle Africa (3.25, a difference of 0.020%).
| Demographics | Rating | Rank | Average Family Size |
| Immigrants | Venezuela | 86.3 /100 | #133 | Excellent 3.26 |
| Africans | 84.9 /100 | #134 | Excellent 3.25 |
| Panamanians | 84.2 /100 | #135 | Excellent 3.25 |
| Comanche | 82.8 /100 | #136 | Excellent 3.25 |
| Immigrants | Middle Africa | 82.4 /100 | #137 | Excellent 3.25 |
| Cubans | 81.8 /100 | #138 | Excellent 3.25 |
| Immigrants | Ethiopia | 81.6 /100 | #139 | Excellent 3.25 |
| Sub-Saharan Africans | 81.6 /100 | #140 | Excellent 3.25 |
| Venezuelans | 81.4 /100 | #141 | Excellent 3.25 |
| Liberians | 81.2 /100 | #142 | Excellent 3.25 |
| Bhutanese | 81.0 /100 | #143 | Excellent 3.25 |
| Tsimshian | 80.2 /100 | #144 | Excellent 3.25 |
| Armenians | 78.2 /100 | #145 | Good 3.25 |
| Immigrants | Africa | 77.9 /100 | #146 | Good 3.25 |
| Immigrants | Jordan | 75.7 /100 | #147 | Good 3.24 |