Immigrants from Poland vs Subsaharan African Average Family Size
COMPARE
Immigrants from Poland
Subsaharan African
Average Family Size
Average Family Size Comparison
Immigrants from Poland
Sub-Saharan Africans
3.20
AVERAGE FAMILY SIZE
16.6/ 100
METRIC RATING
204th/ 347
METRIC RANK
3.25
AVERAGE FAMILY SIZE
81.6/ 100
METRIC RATING
140th/ 347
METRIC RANK
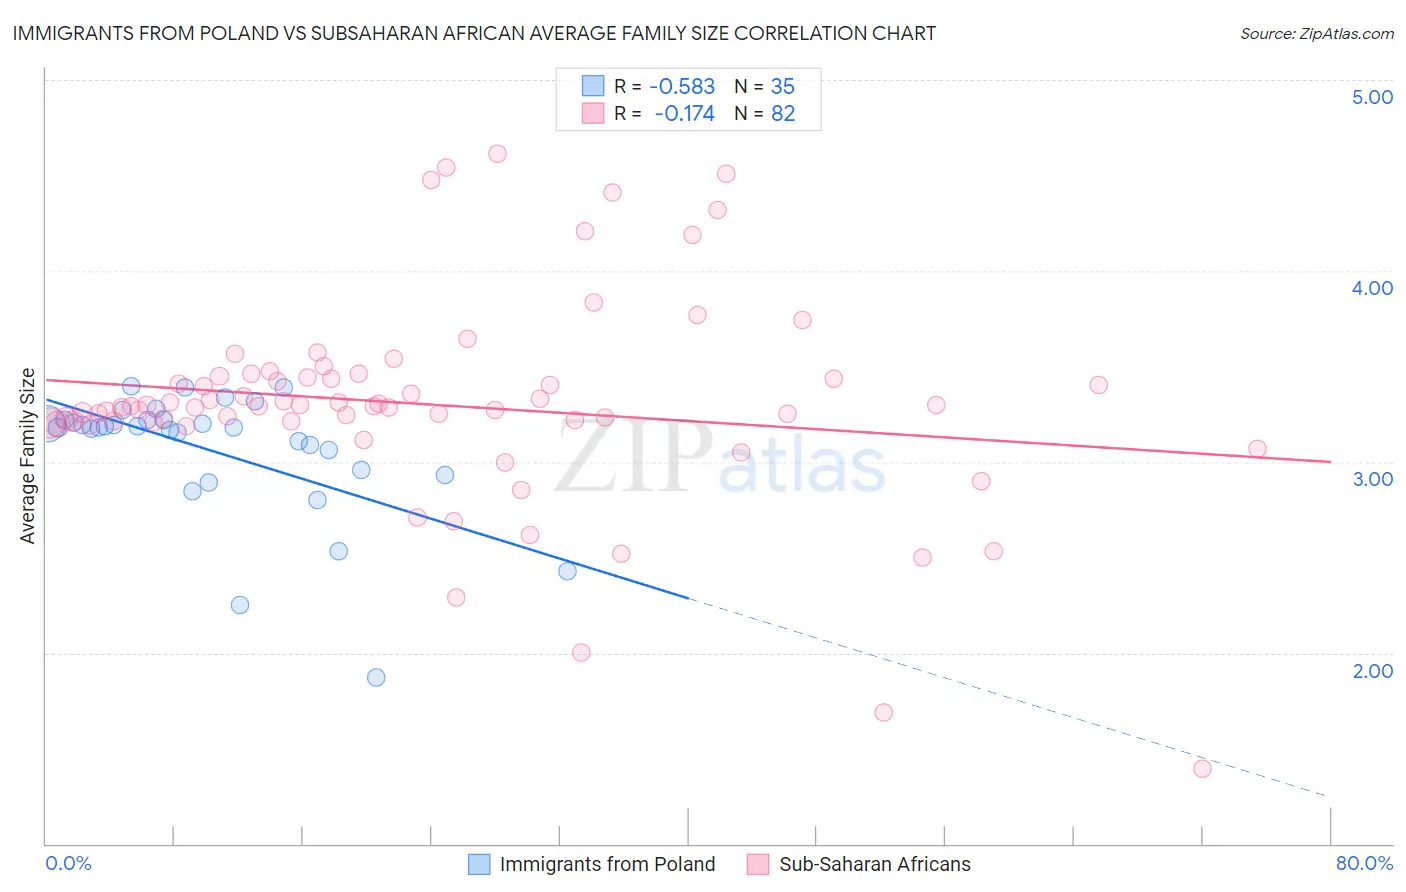
Immigrants from Poland vs Subsaharan African Average Family Size Correlation Chart
The statistical analysis conducted on geographies consisting of 304,786,853 people shows a substantial negative correlation between the proportion of Immigrants from Poland and average family size in the United States with a correlation coefficient (R) of -0.583 and weighted average of 3.20. Similarly, the statistical analysis conducted on geographies consisting of 507,604,346 people shows a poor negative correlation between the proportion of Sub-Saharan Africans and average family size in the United States with a correlation coefficient (R) of -0.174 and weighted average of 3.25, a difference of 1.4%.
Average Family Size Correlation Summary
| Measurement | Immigrants from Poland | Subsaharan African |
| Minimum | 1.87 | 1.39 |
| Maximum | 3.39 | 4.61 |
| Range | 1.52 | 3.22 |
| Mean | 3.06 | 3.30 |
| Median | 3.18 | 3.29 |
| Interquartile 25% (IQ1) | 2.96 | 3.21 |
| Interquartile 75% (IQ3) | 3.22 | 3.44 |
| Interquartile Range (IQR) | 0.26 | 0.23 |
| Standard Deviation (Sample) | 0.33 | 0.54 |
| Standard Deviation (Population) | 0.33 | 0.54 |
Similar Demographics by Average Family Size
Demographics Similar to Immigrants from Poland by Average Family Size
In terms of average family size, the demographic groups most similar to Immigrants from Poland are Paraguayan (3.20, a difference of 0.010%), Immigrants from Cabo Verde (3.20, a difference of 0.020%), Immigrants from Nepal (3.21, a difference of 0.050%), Immigrants from Morocco (3.21, a difference of 0.060%), and Immigrants from India (3.21, a difference of 0.060%).
| Demographics | Rating | Rank | Average Family Size |
| Kenyans | 28.0 /100 | #197 | Fair 3.21 |
| Immigrants | Azores | 21.7 /100 | #198 | Fair 3.21 |
| Hmong | 20.7 /100 | #199 | Fair 3.21 |
| Immigrants | Kenya | 19.2 /100 | #200 | Poor 3.21 |
| Immigrants | Morocco | 18.5 /100 | #201 | Poor 3.21 |
| Immigrants | India | 18.5 /100 | #202 | Poor 3.21 |
| Immigrants | Nepal | 18.1 /100 | #203 | Poor 3.21 |
| Immigrants | Poland | 16.6 /100 | #204 | Poor 3.20 |
| Paraguayans | 16.3 /100 | #205 | Poor 3.20 |
| Immigrants | Cabo Verde | 16.0 /100 | #206 | Poor 3.20 |
| Filipinos | 13.6 /100 | #207 | Poor 3.20 |
| Chippewa | 13.3 /100 | #208 | Poor 3.20 |
| Sudanese | 13.3 /100 | #209 | Poor 3.20 |
| Zimbabweans | 12.6 /100 | #210 | Poor 3.20 |
| Immigrants | Iran | 12.1 /100 | #211 | Poor 3.20 |
Demographics Similar to Sub-Saharan Africans by Average Family Size
In terms of average family size, the demographic groups most similar to Sub-Saharan Africans are Immigrants from Ethiopia (3.25, a difference of 0.0%), Venezuelan (3.25, a difference of 0.0%), Cuban (3.25, a difference of 0.010%), Liberian (3.25, a difference of 0.010%), and Immigrants from Middle Africa (3.25, a difference of 0.020%).
| Demographics | Rating | Rank | Average Family Size |
| Immigrants | Venezuela | 86.3 /100 | #133 | Excellent 3.26 |
| Africans | 84.9 /100 | #134 | Excellent 3.25 |
| Panamanians | 84.2 /100 | #135 | Excellent 3.25 |
| Comanche | 82.8 /100 | #136 | Excellent 3.25 |
| Immigrants | Middle Africa | 82.4 /100 | #137 | Excellent 3.25 |
| Cubans | 81.8 /100 | #138 | Excellent 3.25 |
| Immigrants | Ethiopia | 81.6 /100 | #139 | Excellent 3.25 |
| Sub-Saharan Africans | 81.6 /100 | #140 | Excellent 3.25 |
| Venezuelans | 81.4 /100 | #141 | Excellent 3.25 |
| Liberians | 81.2 /100 | #142 | Excellent 3.25 |
| Bhutanese | 81.0 /100 | #143 | Excellent 3.25 |
| Tsimshian | 80.2 /100 | #144 | Excellent 3.25 |
| Armenians | 78.2 /100 | #145 | Good 3.25 |
| Immigrants | Africa | 77.9 /100 | #146 | Good 3.25 |
| Immigrants | Jordan | 75.7 /100 | #147 | Good 3.24 |