Guyanese vs Barbadian Average Family Size
COMPARE
Guyanese
Barbadian
Average Family Size
Average Family Size Comparison
Guyanese
Barbadians
3.40
AVERAGE FAMILY SIZE
100.0/ 100
METRIC RATING
37th/ 347
METRIC RANK
3.29
AVERAGE FAMILY SIZE
98.6/ 100
METRIC RATING
98th/ 347
METRIC RANK
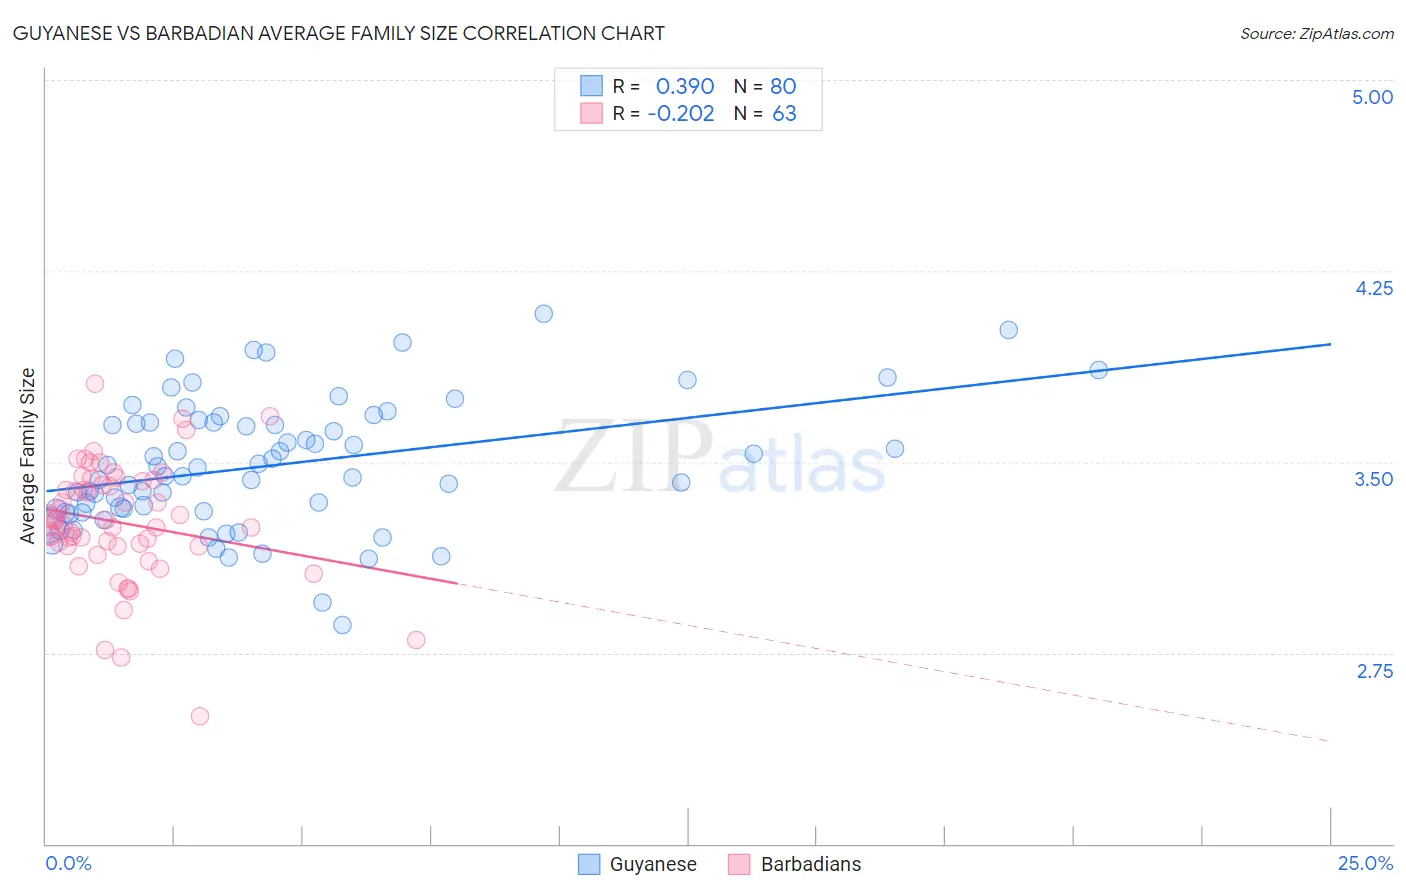
Guyanese vs Barbadian Average Family Size Correlation Chart
The statistical analysis conducted on geographies consisting of 176,801,738 people shows a mild positive correlation between the proportion of Guyanese and average family size in the United States with a correlation coefficient (R) of 0.390 and weighted average of 3.40. Similarly, the statistical analysis conducted on geographies consisting of 141,251,330 people shows a weak negative correlation between the proportion of Barbadians and average family size in the United States with a correlation coefficient (R) of -0.202 and weighted average of 3.29, a difference of 3.3%.
Average Family Size Correlation Summary
| Measurement | Guyanese | Barbadian |
| Minimum | 2.86 | 2.50 |
| Maximum | 4.08 | 3.81 |
| Range | 1.22 | 1.31 |
| Mean | 3.49 | 3.26 |
| Median | 3.46 | 3.27 |
| Interquartile 25% (IQ1) | 3.31 | 3.17 |
| Interquartile 75% (IQ3) | 3.65 | 3.43 |
| Interquartile Range (IQR) | 0.34 | 0.26 |
| Standard Deviation (Sample) | 0.25 | 0.23 |
| Standard Deviation (Population) | 0.25 | 0.23 |
Similar Demographics by Average Family Size
Demographics Similar to Guyanese by Average Family Size
In terms of average family size, the demographic groups most similar to Guyanese are Immigrants from Guyana (3.40, a difference of 0.14%), Immigrants from Belize (3.39, a difference of 0.16%), Guatemalan (3.40, a difference of 0.19%), Immigrants from Haiti (3.39, a difference of 0.24%), and Hispanic or Latino (3.41, a difference of 0.25%).
| Demographics | Rating | Rank | Average Family Size |
| Samoans | 100.0 /100 | #30 | Exceptional 3.42 |
| Central Americans | 100.0 /100 | #31 | Exceptional 3.41 |
| Immigrants | Guatemala | 100.0 /100 | #32 | Exceptional 3.41 |
| Hawaiians | 100.0 /100 | #33 | Exceptional 3.41 |
| Hispanics or Latinos | 100.0 /100 | #34 | Exceptional 3.41 |
| Guatemalans | 100.0 /100 | #35 | Exceptional 3.40 |
| Immigrants | Guyana | 100.0 /100 | #36 | Exceptional 3.40 |
| Guyanese | 100.0 /100 | #37 | Exceptional 3.40 |
| Immigrants | Belize | 100.0 /100 | #38 | Exceptional 3.39 |
| Immigrants | Haiti | 100.0 /100 | #39 | Exceptional 3.39 |
| Belizeans | 100.0 /100 | #40 | Exceptional 3.39 |
| Marshallese | 100.0 /100 | #41 | Exceptional 3.38 |
| Immigrants | Vietnam | 100.0 /100 | #42 | Exceptional 3.38 |
| Immigrants | Philippines | 100.0 /100 | #43 | Exceptional 3.37 |
| Alaska Natives | 100.0 /100 | #44 | Exceptional 3.37 |
Demographics Similar to Barbadians by Average Family Size
In terms of average family size, the demographic groups most similar to Barbadians are Immigrants from Oceania (3.29, a difference of 0.0%), Nigerian (3.29, a difference of 0.0%), Guamanian/Chamorro (3.29, a difference of 0.010%), Immigrants from Burma/Myanmar (3.29, a difference of 0.030%), and West Indian (3.29, a difference of 0.030%).
| Demographics | Rating | Rank | Average Family Size |
| Immigrants | Pakistan | 99.2 /100 | #91 | Exceptional 3.30 |
| Immigrants | Cameroon | 99.2 /100 | #92 | Exceptional 3.30 |
| Peruvians | 99.2 /100 | #93 | Exceptional 3.30 |
| Sierra Leoneans | 99.0 /100 | #94 | Exceptional 3.30 |
| Immigrants | Lebanon | 99.0 /100 | #95 | Exceptional 3.30 |
| U.S. Virgin Islanders | 98.8 /100 | #96 | Exceptional 3.29 |
| Immigrants | Oceania | 98.7 /100 | #97 | Exceptional 3.29 |
| Barbadians | 98.6 /100 | #98 | Exceptional 3.29 |
| Nigerians | 98.6 /100 | #99 | Exceptional 3.29 |
| Guamanians/Chamorros | 98.6 /100 | #100 | Exceptional 3.29 |
| Immigrants | Burma/Myanmar | 98.6 /100 | #101 | Exceptional 3.29 |
| West Indians | 98.5 /100 | #102 | Exceptional 3.29 |
| Immigrants | Western Africa | 98.4 /100 | #103 | Exceptional 3.29 |
| Bolivians | 98.3 /100 | #104 | Exceptional 3.29 |
| Immigrants | Ghana | 98.1 /100 | #105 | Exceptional 3.29 |