Guyanese vs Immigrants from Argentina Average Family Size
COMPARE
Guyanese
Immigrants from Argentina
Average Family Size
Average Family Size Comparison
Guyanese
Immigrants from Argentina
3.40
AVERAGE FAMILY SIZE
100.0/ 100
METRIC RATING
37th/ 347
METRIC RANK
3.22
AVERAGE FAMILY SIZE
39.8/ 100
METRIC RATING
186th/ 347
METRIC RANK
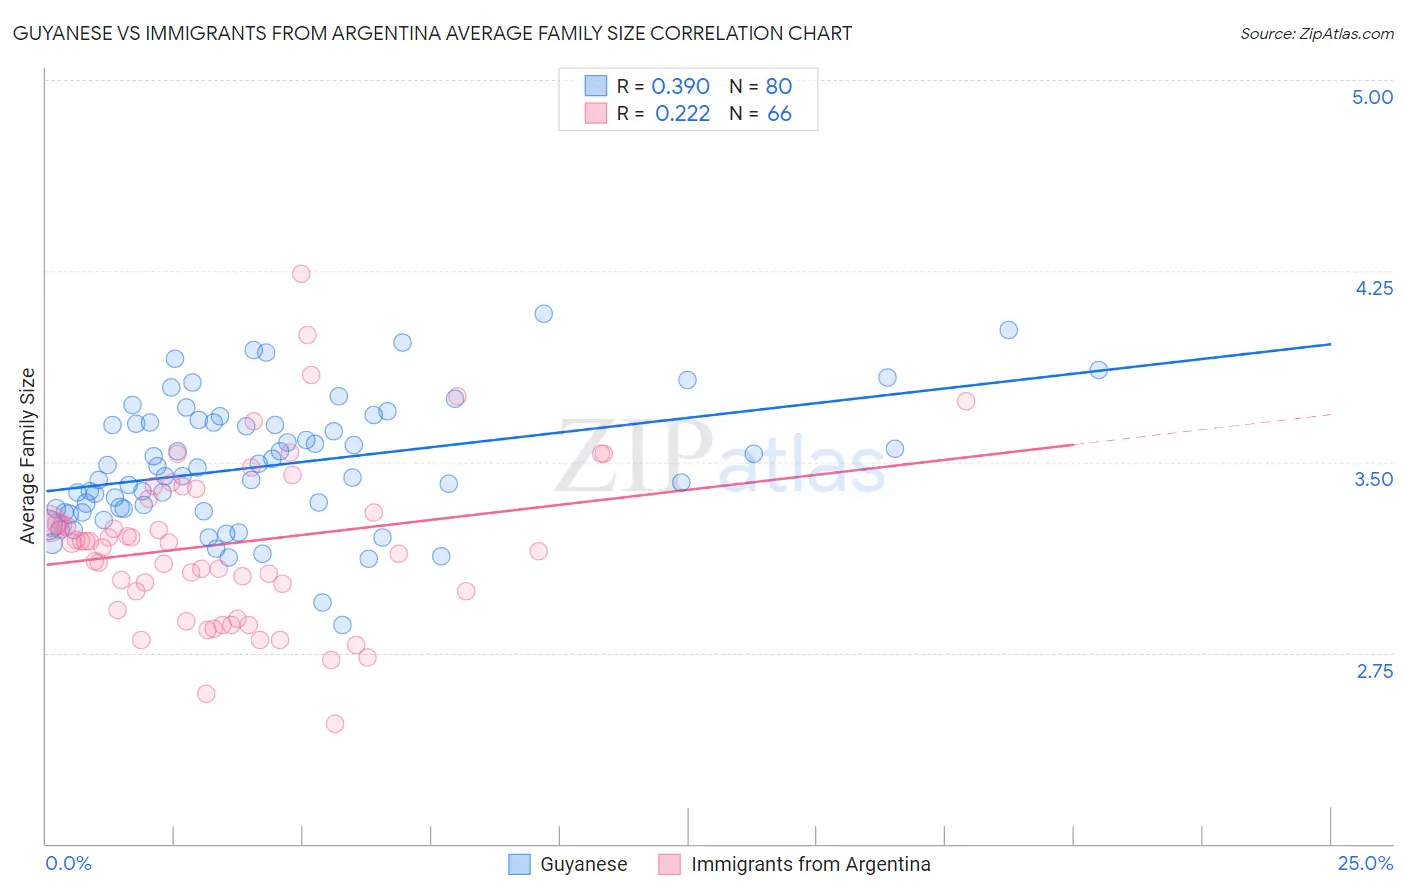
Guyanese vs Immigrants from Argentina Average Family Size Correlation Chart
The statistical analysis conducted on geographies consisting of 176,801,738 people shows a mild positive correlation between the proportion of Guyanese and average family size in the United States with a correlation coefficient (R) of 0.390 and weighted average of 3.40. Similarly, the statistical analysis conducted on geographies consisting of 264,360,356 people shows a weak positive correlation between the proportion of Immigrants from Argentina and average family size in the United States with a correlation coefficient (R) of 0.222 and weighted average of 3.22, a difference of 5.5%.
Average Family Size Correlation Summary
| Measurement | Guyanese | Immigrants from Argentina |
| Minimum | 2.86 | 2.47 |
| Maximum | 4.08 | 4.24 |
| Range | 1.22 | 1.77 |
| Mean | 3.49 | 3.18 |
| Median | 3.46 | 3.18 |
| Interquartile 25% (IQ1) | 3.31 | 2.99 |
| Interquartile 75% (IQ3) | 3.65 | 3.36 |
| Interquartile Range (IQR) | 0.34 | 0.37 |
| Standard Deviation (Sample) | 0.25 | 0.33 |
| Standard Deviation (Population) | 0.25 | 0.32 |
Similar Demographics by Average Family Size
Demographics Similar to Guyanese by Average Family Size
In terms of average family size, the demographic groups most similar to Guyanese are Immigrants from Guyana (3.40, a difference of 0.14%), Immigrants from Belize (3.39, a difference of 0.16%), Guatemalan (3.40, a difference of 0.19%), Immigrants from Haiti (3.39, a difference of 0.24%), and Hispanic or Latino (3.41, a difference of 0.25%).
| Demographics | Rating | Rank | Average Family Size |
| Samoans | 100.0 /100 | #30 | Exceptional 3.42 |
| Central Americans | 100.0 /100 | #31 | Exceptional 3.41 |
| Immigrants | Guatemala | 100.0 /100 | #32 | Exceptional 3.41 |
| Hawaiians | 100.0 /100 | #33 | Exceptional 3.41 |
| Hispanics or Latinos | 100.0 /100 | #34 | Exceptional 3.41 |
| Guatemalans | 100.0 /100 | #35 | Exceptional 3.40 |
| Immigrants | Guyana | 100.0 /100 | #36 | Exceptional 3.40 |
| Guyanese | 100.0 /100 | #37 | Exceptional 3.40 |
| Immigrants | Belize | 100.0 /100 | #38 | Exceptional 3.39 |
| Immigrants | Haiti | 100.0 /100 | #39 | Exceptional 3.39 |
| Belizeans | 100.0 /100 | #40 | Exceptional 3.39 |
| Marshallese | 100.0 /100 | #41 | Exceptional 3.38 |
| Immigrants | Vietnam | 100.0 /100 | #42 | Exceptional 3.38 |
| Immigrants | Philippines | 100.0 /100 | #43 | Exceptional 3.37 |
| Alaska Natives | 100.0 /100 | #44 | Exceptional 3.37 |
Demographics Similar to Immigrants from Argentina by Average Family Size
In terms of average family size, the demographic groups most similar to Immigrants from Argentina are Immigrants from Sri Lanka (3.22, a difference of 0.0%), Immigrants from Eastern Asia (3.22, a difference of 0.020%), Immigrants from Malaysia (3.22, a difference of 0.020%), Thai (3.22, a difference of 0.030%), and Immigrants from Northern Africa (3.22, a difference of 0.040%).
| Demographics | Rating | Rank | Average Family Size |
| Immigrants | Korea | 46.9 /100 | #179 | Average 3.23 |
| Palestinians | 46.6 /100 | #180 | Average 3.23 |
| Spanish | 44.8 /100 | #181 | Average 3.23 |
| Moroccans | 44.2 /100 | #182 | Average 3.22 |
| Immigrants | Northern Africa | 41.7 /100 | #183 | Average 3.22 |
| Immigrants | Eastern Asia | 40.8 /100 | #184 | Average 3.22 |
| Immigrants | Sri Lanka | 39.8 /100 | #185 | Fair 3.22 |
| Immigrants | Argentina | 39.8 /100 | #186 | Fair 3.22 |
| Immigrants | Malaysia | 39.0 /100 | #187 | Fair 3.22 |
| Thais | 38.3 /100 | #188 | Fair 3.22 |
| Pakistanis | 33.7 /100 | #189 | Fair 3.22 |
| Burmese | 31.0 /100 | #190 | Fair 3.22 |
| Immigrants | Zaire | 30.5 /100 | #191 | Fair 3.22 |
| Immigrants | Eastern Africa | 30.1 /100 | #192 | Fair 3.22 |
| Immigrants | Israel | 29.3 /100 | #193 | Fair 3.22 |