Guyanese vs Tlingit-Haida Average Family Size
COMPARE
Guyanese
Tlingit-Haida
Average Family Size
Average Family Size Comparison
Guyanese
Tlingit-Haida
3.40
AVERAGE FAMILY SIZE
100.0/ 100
METRIC RATING
37th/ 347
METRIC RANK
3.16
AVERAGE FAMILY SIZE
0.7/ 100
METRIC RATING
270th/ 347
METRIC RANK
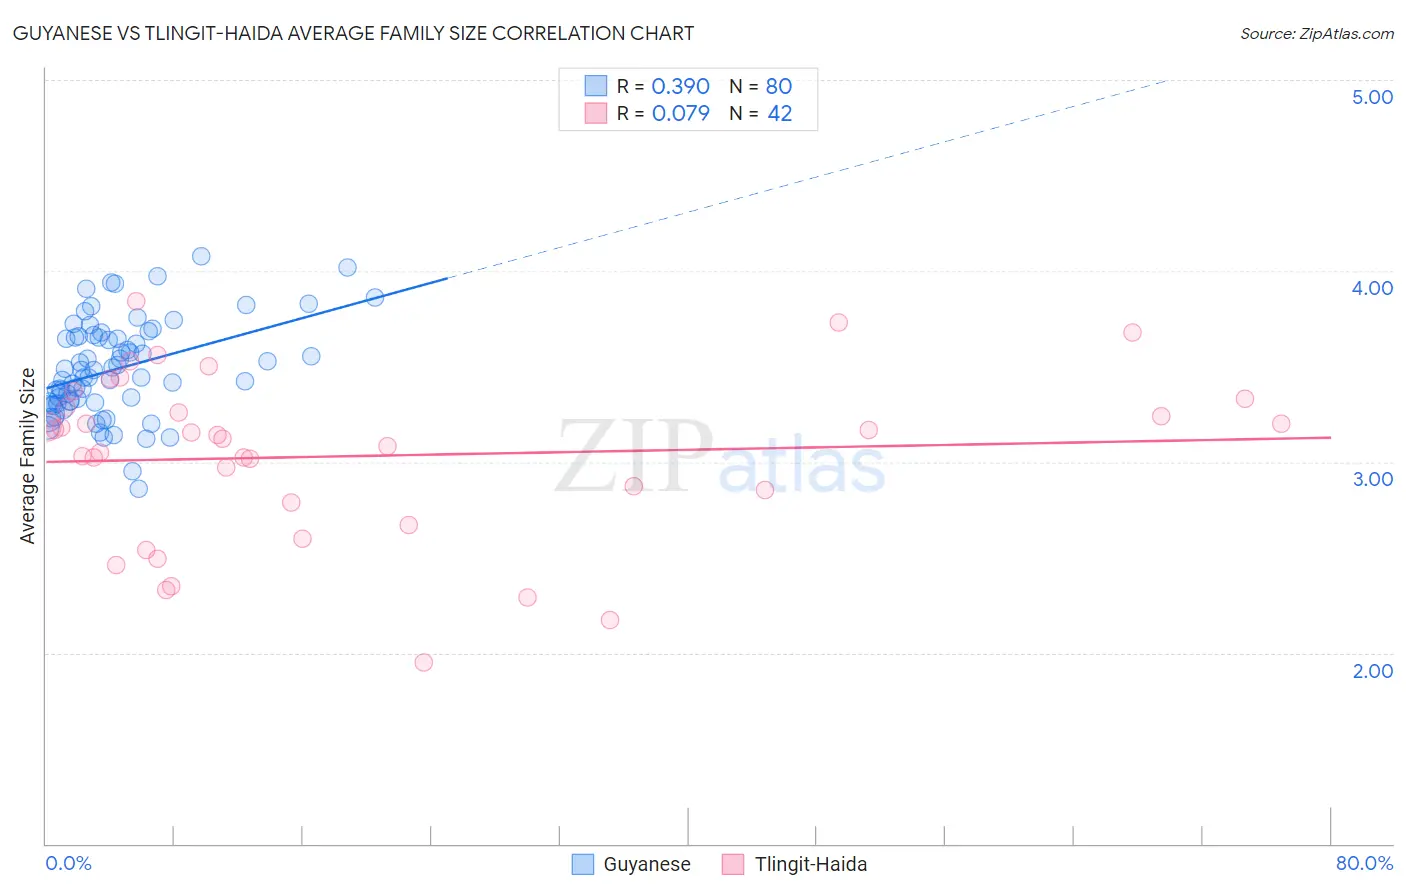
Guyanese vs Tlingit-Haida Average Family Size Correlation Chart
The statistical analysis conducted on geographies consisting of 176,801,738 people shows a mild positive correlation between the proportion of Guyanese and average family size in the United States with a correlation coefficient (R) of 0.390 and weighted average of 3.40. Similarly, the statistical analysis conducted on geographies consisting of 60,855,605 people shows a slight positive correlation between the proportion of Tlingit-Haida and average family size in the United States with a correlation coefficient (R) of 0.079 and weighted average of 3.16, a difference of 7.7%.
Average Family Size Correlation Summary
| Measurement | Guyanese | Tlingit-Haida |
| Minimum | 2.86 | 1.95 |
| Maximum | 4.08 | 3.84 |
| Range | 1.22 | 1.89 |
| Mean | 3.49 | 3.03 |
| Median | 3.46 | 3.13 |
| Interquartile 25% (IQ1) | 3.31 | 2.79 |
| Interquartile 75% (IQ3) | 3.65 | 3.29 |
| Interquartile Range (IQR) | 0.34 | 0.50 |
| Standard Deviation (Sample) | 0.25 | 0.44 |
| Standard Deviation (Population) | 0.25 | 0.43 |
Similar Demographics by Average Family Size
Demographics Similar to Guyanese by Average Family Size
In terms of average family size, the demographic groups most similar to Guyanese are Immigrants from Guyana (3.40, a difference of 0.14%), Immigrants from Belize (3.39, a difference of 0.16%), Guatemalan (3.40, a difference of 0.19%), Immigrants from Haiti (3.39, a difference of 0.24%), and Hispanic or Latino (3.41, a difference of 0.25%).
| Demographics | Rating | Rank | Average Family Size |
| Samoans | 100.0 /100 | #30 | Exceptional 3.42 |
| Central Americans | 100.0 /100 | #31 | Exceptional 3.41 |
| Immigrants | Guatemala | 100.0 /100 | #32 | Exceptional 3.41 |
| Hawaiians | 100.0 /100 | #33 | Exceptional 3.41 |
| Hispanics or Latinos | 100.0 /100 | #34 | Exceptional 3.41 |
| Guatemalans | 100.0 /100 | #35 | Exceptional 3.40 |
| Immigrants | Guyana | 100.0 /100 | #36 | Exceptional 3.40 |
| Guyanese | 100.0 /100 | #37 | Exceptional 3.40 |
| Immigrants | Belize | 100.0 /100 | #38 | Exceptional 3.39 |
| Immigrants | Haiti | 100.0 /100 | #39 | Exceptional 3.39 |
| Belizeans | 100.0 /100 | #40 | Exceptional 3.39 |
| Marshallese | 100.0 /100 | #41 | Exceptional 3.38 |
| Immigrants | Vietnam | 100.0 /100 | #42 | Exceptional 3.38 |
| Immigrants | Philippines | 100.0 /100 | #43 | Exceptional 3.37 |
| Alaska Natives | 100.0 /100 | #44 | Exceptional 3.37 |
Demographics Similar to Tlingit-Haida by Average Family Size
In terms of average family size, the demographic groups most similar to Tlingit-Haida are Immigrants from Germany (3.15, a difference of 0.020%), Immigrants from Singapore (3.16, a difference of 0.030%), Maltese (3.16, a difference of 0.040%), Immigrants from Lithuania (3.15, a difference of 0.040%), and New Zealander (3.15, a difference of 0.060%).
| Demographics | Rating | Rank | Average Family Size |
| Immigrants | Bulgaria | 1.0 /100 | #263 | Tragic 3.16 |
| Americans | 1.0 /100 | #264 | Tragic 3.16 |
| Immigrants | South Africa | 0.9 /100 | #265 | Tragic 3.16 |
| Immigrants | Greece | 0.9 /100 | #266 | Tragic 3.16 |
| Iroquois | 0.8 /100 | #267 | Tragic 3.16 |
| Maltese | 0.8 /100 | #268 | Tragic 3.16 |
| Immigrants | Singapore | 0.7 /100 | #269 | Tragic 3.16 |
| Tlingit-Haida | 0.7 /100 | #270 | Tragic 3.16 |
| Immigrants | Germany | 0.7 /100 | #271 | Tragic 3.15 |
| Immigrants | Lithuania | 0.6 /100 | #272 | Tragic 3.15 |
| New Zealanders | 0.6 /100 | #273 | Tragic 3.15 |
| Immigrants | Belgium | 0.6 /100 | #274 | Tragic 3.15 |
| Cambodians | 0.6 /100 | #275 | Tragic 3.15 |
| Immigrants | Bosnia and Herzegovina | 0.5 /100 | #276 | Tragic 3.15 |
| Swiss | 0.5 /100 | #277 | Tragic 3.15 |