Immigrants from Micronesia vs Subsaharan African Average Family Size
COMPARE
Immigrants from Micronesia
Subsaharan African
Average Family Size
Average Family Size Comparison
Immigrants from Micronesia
Sub-Saharan Africans
3.32
AVERAGE FAMILY SIZE
99.8/ 100
METRIC RATING
78th/ 347
METRIC RANK
3.25
AVERAGE FAMILY SIZE
81.6/ 100
METRIC RATING
140th/ 347
METRIC RANK
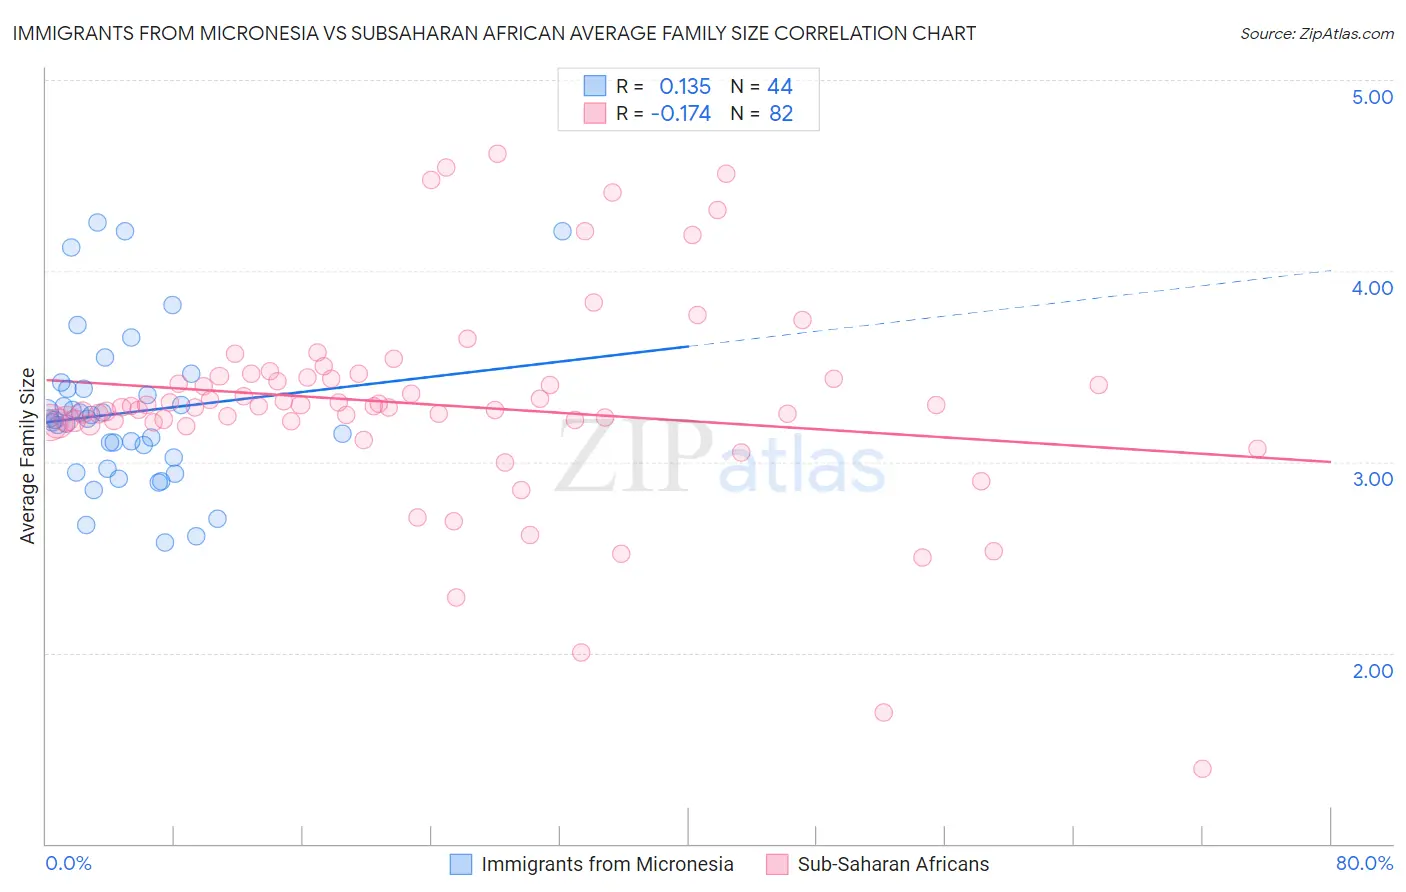
Immigrants from Micronesia vs Subsaharan African Average Family Size Correlation Chart
The statistical analysis conducted on geographies consisting of 61,601,070 people shows a poor positive correlation between the proportion of Immigrants from Micronesia and average family size in the United States with a correlation coefficient (R) of 0.135 and weighted average of 3.32. Similarly, the statistical analysis conducted on geographies consisting of 507,604,346 people shows a poor negative correlation between the proportion of Sub-Saharan Africans and average family size in the United States with a correlation coefficient (R) of -0.174 and weighted average of 3.25, a difference of 2.2%.
Average Family Size Correlation Summary
| Measurement | Immigrants from Micronesia | Subsaharan African |
| Minimum | 2.58 | 1.39 |
| Maximum | 4.26 | 4.61 |
| Range | 1.68 | 3.22 |
| Mean | 3.26 | 3.30 |
| Median | 3.22 | 3.29 |
| Interquartile 25% (IQ1) | 3.00 | 3.21 |
| Interquartile 75% (IQ3) | 3.38 | 3.44 |
| Interquartile Range (IQR) | 0.39 | 0.23 |
| Standard Deviation (Sample) | 0.40 | 0.54 |
| Standard Deviation (Population) | 0.40 | 0.54 |
Similar Demographics by Average Family Size
Demographics Similar to Immigrants from Micronesia by Average Family Size
In terms of average family size, the demographic groups most similar to Immigrants from Micronesia are British West Indian (3.32, a difference of 0.010%), Lumbee (3.32, a difference of 0.030%), Immigrants from Ecuador (3.32, a difference of 0.040%), Trinidadian and Tobagonian (3.32, a difference of 0.050%), and Immigrants from Barbados (3.32, a difference of 0.070%).
| Demographics | Rating | Rank | Average Family Size |
| Immigrants | West Indies | 99.9 /100 | #71 | Exceptional 3.33 |
| Immigrants | Caribbean | 99.9 /100 | #72 | Exceptional 3.33 |
| Yaqui | 99.9 /100 | #73 | Exceptional 3.32 |
| Immigrants | Sierra Leone | 99.9 /100 | #74 | Exceptional 3.32 |
| Immigrants | Barbados | 99.8 /100 | #75 | Exceptional 3.32 |
| Trinidadians and Tobagonians | 99.8 /100 | #76 | Exceptional 3.32 |
| Immigrants | Ecuador | 99.8 /100 | #77 | Exceptional 3.32 |
| Immigrants | Micronesia | 99.8 /100 | #78 | Exceptional 3.32 |
| British West Indians | 99.8 /100 | #79 | Exceptional 3.32 |
| Lumbee | 99.8 /100 | #80 | Exceptional 3.32 |
| Immigrants | Dominica | 99.8 /100 | #81 | Exceptional 3.32 |
| Ecuadorians | 99.8 /100 | #82 | Exceptional 3.32 |
| Immigrants | Afghanistan | 99.8 /100 | #83 | Exceptional 3.32 |
| Immigrants | Nigeria | 99.7 /100 | #84 | Exceptional 3.32 |
| Afghans | 99.7 /100 | #85 | Exceptional 3.31 |
Demographics Similar to Sub-Saharan Africans by Average Family Size
In terms of average family size, the demographic groups most similar to Sub-Saharan Africans are Immigrants from Ethiopia (3.25, a difference of 0.0%), Venezuelan (3.25, a difference of 0.0%), Cuban (3.25, a difference of 0.010%), Liberian (3.25, a difference of 0.010%), and Immigrants from Middle Africa (3.25, a difference of 0.020%).
| Demographics | Rating | Rank | Average Family Size |
| Immigrants | Venezuela | 86.3 /100 | #133 | Excellent 3.26 |
| Africans | 84.9 /100 | #134 | Excellent 3.25 |
| Panamanians | 84.2 /100 | #135 | Excellent 3.25 |
| Comanche | 82.8 /100 | #136 | Excellent 3.25 |
| Immigrants | Middle Africa | 82.4 /100 | #137 | Excellent 3.25 |
| Cubans | 81.8 /100 | #138 | Excellent 3.25 |
| Immigrants | Ethiopia | 81.6 /100 | #139 | Excellent 3.25 |
| Sub-Saharan Africans | 81.6 /100 | #140 | Excellent 3.25 |
| Venezuelans | 81.4 /100 | #141 | Excellent 3.25 |
| Liberians | 81.2 /100 | #142 | Excellent 3.25 |
| Bhutanese | 81.0 /100 | #143 | Excellent 3.25 |
| Tsimshian | 80.2 /100 | #144 | Excellent 3.25 |
| Armenians | 78.2 /100 | #145 | Good 3.25 |
| Immigrants | Africa | 77.9 /100 | #146 | Good 3.25 |
| Immigrants | Jordan | 75.7 /100 | #147 | Good 3.24 |