Nonimmigrants vs Sudanese Currently Married
COMPARE
Nonimmigrants
Sudanese
Currently Married
Currently Married Comparison
Nonimmigrants
Sudanese
46.9%
CURRENTLY MARRIED
65.4/ 100
METRIC RATING
162nd/ 347
METRIC RANK
43.7%
CURRENTLY MARRIED
0.1/ 100
METRIC RATING
264th/ 347
METRIC RANK
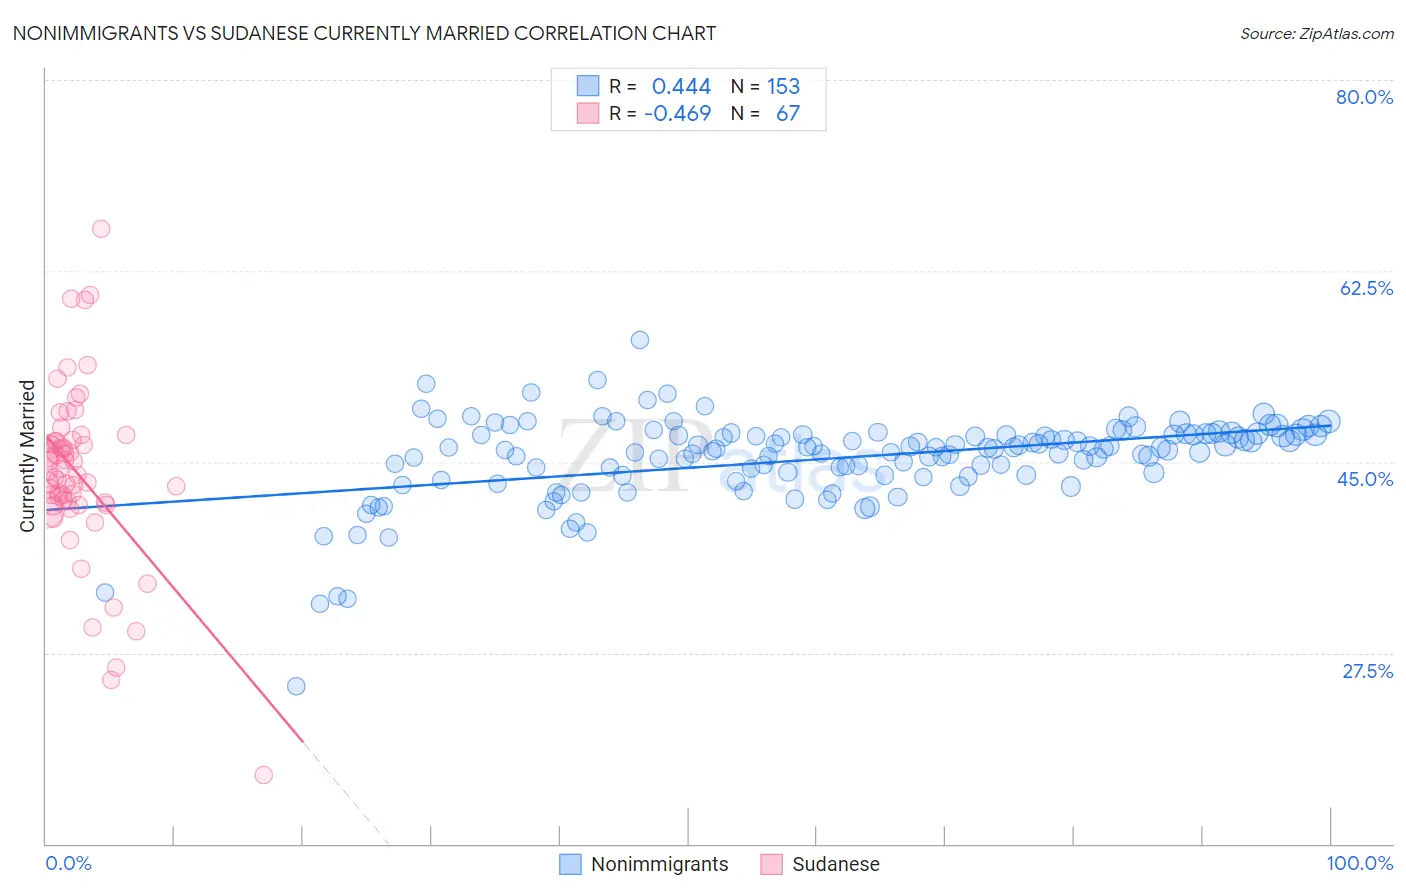
Nonimmigrants vs Sudanese Currently Married Correlation Chart
The statistical analysis conducted on geographies consisting of 585,180,453 people shows a moderate positive correlation between the proportion of Nonimmigrants and percentage of population currently married in the United States with a correlation coefficient (R) of 0.444 and weighted average of 46.9%. Similarly, the statistical analysis conducted on geographies consisting of 110,133,540 people shows a moderate negative correlation between the proportion of Sudanese and percentage of population currently married in the United States with a correlation coefficient (R) of -0.469 and weighted average of 43.7%, a difference of 7.4%.
Currently Married Correlation Summary
| Measurement | Nonimmigrants | Sudanese |
| Minimum | 24.5% | 16.3% |
| Maximum | 56.2% | 66.4% |
| Range | 31.7% | 50.1% |
| Mean | 45.3% | 43.9% |
| Median | 46.3% | 44.3% |
| Interquartile 25% (IQ1) | 43.8% | 41.3% |
| Interquartile 75% (IQ3) | 47.5% | 46.9% |
| Interquartile Range (IQR) | 3.7% | 5.6% |
| Standard Deviation (Sample) | 4.0% | 8.0% |
| Standard Deviation (Population) | 4.0% | 7.9% |
Similar Demographics by Currently Married
Demographics Similar to Nonimmigrants by Currently Married
In terms of currently married, the demographic groups most similar to Nonimmigrants are Immigrants from Uzbekistan (46.9%, a difference of 0.020%), Immigrants from Southern Europe (46.9%, a difference of 0.020%), Delaware (46.9%, a difference of 0.030%), Iraqi (46.9%, a difference of 0.040%), and Immigrants from Western Asia (46.9%, a difference of 0.050%).
| Demographics | Rating | Rank | Currently Married |
| Arabs | 68.6 /100 | #155 | Good 47.0% |
| Spanish | 68.1 /100 | #156 | Good 47.0% |
| Immigrants | Switzerland | 67.8 /100 | #157 | Good 46.9% |
| Cherokee | 66.8 /100 | #158 | Good 46.9% |
| Iraqis | 66.4 /100 | #159 | Good 46.9% |
| Immigrants | Uzbekistan | 66.0 /100 | #160 | Good 46.9% |
| Immigrants | Southern Europe | 65.9 /100 | #161 | Good 46.9% |
| Immigrants | Nonimmigrants | 65.4 /100 | #162 | Good 46.9% |
| Delaware | 64.7 /100 | #163 | Good 46.9% |
| Immigrants | Western Asia | 64.2 /100 | #164 | Good 46.9% |
| Samoans | 59.8 /100 | #165 | Average 46.8% |
| Immigrants | Syria | 59.3 /100 | #166 | Average 46.8% |
| Spaniards | 58.8 /100 | #167 | Average 46.8% |
| Immigrants | Afghanistan | 58.2 /100 | #168 | Average 46.8% |
| Armenians | 58.2 /100 | #169 | Average 46.8% |
Demographics Similar to Sudanese by Currently Married
In terms of currently married, the demographic groups most similar to Sudanese are Immigrants from Cuba (43.7%, a difference of 0.010%), Bangladeshi (43.7%, a difference of 0.050%), Immigrants from Bangladesh (43.6%, a difference of 0.080%), Ecuadorian (43.6%, a difference of 0.15%), and Immigrants from Eritrea (43.6%, a difference of 0.18%).
| Demographics | Rating | Rank | Currently Married |
| Immigrants | Africa | 0.2 /100 | #257 | Tragic 43.9% |
| Ute | 0.2 /100 | #258 | Tragic 43.9% |
| Immigrants | Sierra Leone | 0.1 /100 | #259 | Tragic 43.8% |
| Immigrants | Latin America | 0.1 /100 | #260 | Tragic 43.8% |
| Immigrants | Nicaragua | 0.1 /100 | #261 | Tragic 43.7% |
| Bangladeshis | 0.1 /100 | #262 | Tragic 43.7% |
| Immigrants | Cuba | 0.1 /100 | #263 | Tragic 43.7% |
| Sudanese | 0.1 /100 | #264 | Tragic 43.7% |
| Immigrants | Bangladesh | 0.1 /100 | #265 | Tragic 43.6% |
| Ecuadorians | 0.1 /100 | #266 | Tragic 43.6% |
| Immigrants | Eritrea | 0.1 /100 | #267 | Tragic 43.6% |
| Spanish American Indians | 0.1 /100 | #268 | Tragic 43.6% |
| Immigrants | Sudan | 0.1 /100 | #269 | Tragic 43.5% |
| Salvadorans | 0.1 /100 | #270 | Tragic 43.5% |
| Bermudans | 0.1 /100 | #271 | Tragic 43.5% |