Immigrants from Afghanistan vs Sudanese Currently Married
COMPARE
Immigrants from Afghanistan
Sudanese
Currently Married
Currently Married Comparison
Immigrants from Afghanistan
Sudanese
46.8%
CURRENTLY MARRIED
58.2/ 100
METRIC RATING
168th/ 347
METRIC RANK
43.7%
CURRENTLY MARRIED
0.1/ 100
METRIC RATING
264th/ 347
METRIC RANK
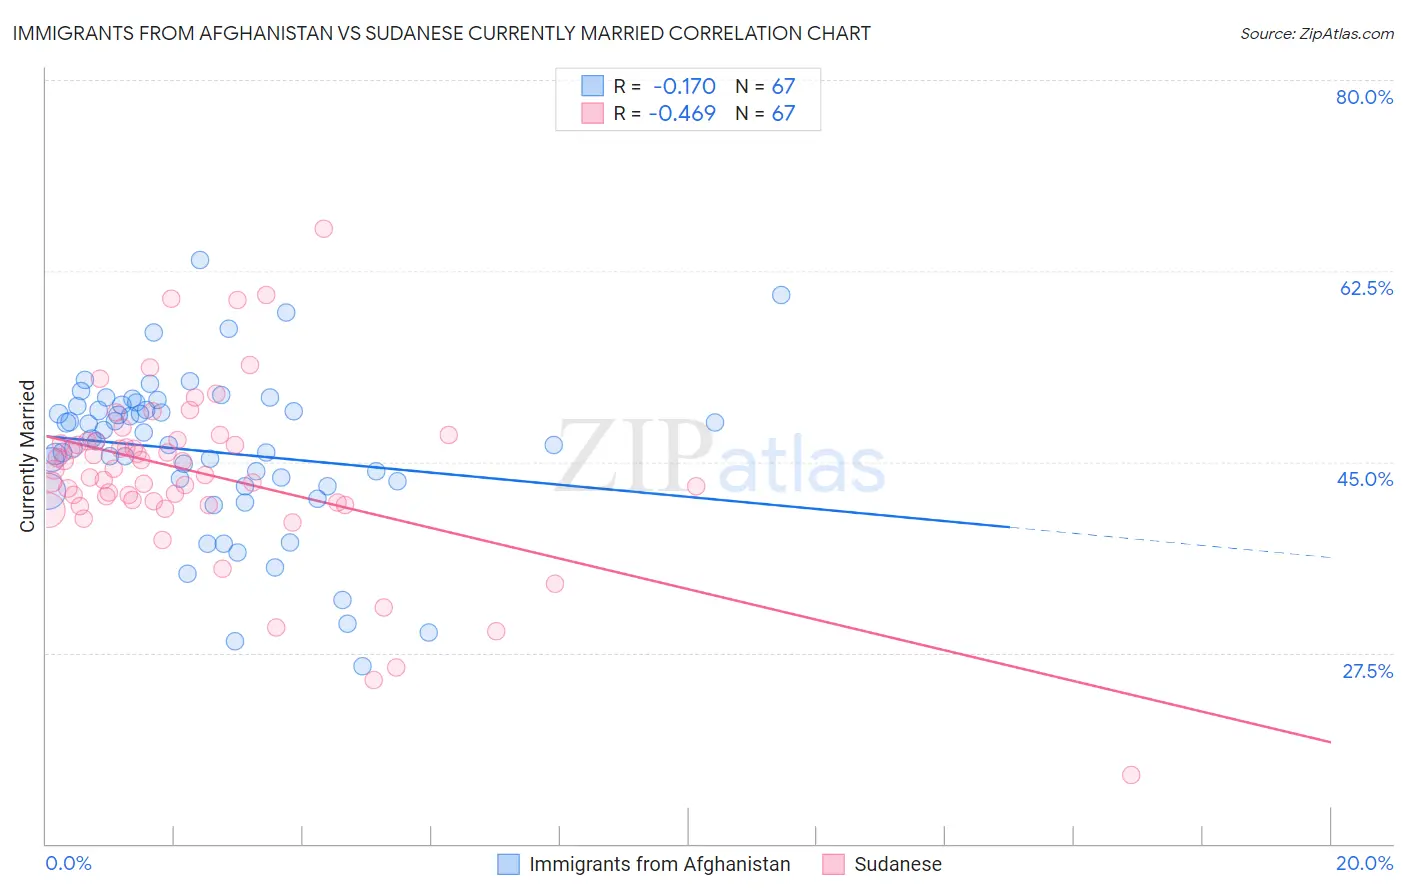
Immigrants from Afghanistan vs Sudanese Currently Married Correlation Chart
The statistical analysis conducted on geographies consisting of 147,642,585 people shows a poor negative correlation between the proportion of Immigrants from Afghanistan and percentage of population currently married in the United States with a correlation coefficient (R) of -0.170 and weighted average of 46.8%. Similarly, the statistical analysis conducted on geographies consisting of 110,133,540 people shows a moderate negative correlation between the proportion of Sudanese and percentage of population currently married in the United States with a correlation coefficient (R) of -0.469 and weighted average of 43.7%, a difference of 7.1%.
Currently Married Correlation Summary
| Measurement | Immigrants from Afghanistan | Sudanese |
| Minimum | 26.3% | 16.3% |
| Maximum | 63.5% | 66.4% |
| Range | 37.2% | 50.1% |
| Mean | 46.0% | 43.9% |
| Median | 46.9% | 44.3% |
| Interquartile 25% (IQ1) | 42.8% | 41.3% |
| Interquartile 75% (IQ3) | 50.1% | 46.9% |
| Interquartile Range (IQR) | 7.3% | 5.6% |
| Standard Deviation (Sample) | 7.2% | 8.0% |
| Standard Deviation (Population) | 7.2% | 7.9% |
Similar Demographics by Currently Married
Demographics Similar to Immigrants from Afghanistan by Currently Married
In terms of currently married, the demographic groups most similar to Immigrants from Afghanistan are Armenian (46.8%, a difference of 0.0%), Spaniard (46.8%, a difference of 0.020%), Immigrants from Syria (46.8%, a difference of 0.040%), Samoan (46.8%, a difference of 0.060%), and Immigrants from Latvia (46.7%, a difference of 0.060%).
| Demographics | Rating | Rank | Currently Married |
| Immigrants | Southern Europe | 65.9 /100 | #161 | Good 46.9% |
| Immigrants | Nonimmigrants | 65.4 /100 | #162 | Good 46.9% |
| Delaware | 64.7 /100 | #163 | Good 46.9% |
| Immigrants | Western Asia | 64.2 /100 | #164 | Good 46.9% |
| Samoans | 59.8 /100 | #165 | Average 46.8% |
| Immigrants | Syria | 59.3 /100 | #166 | Average 46.8% |
| Spaniards | 58.8 /100 | #167 | Average 46.8% |
| Immigrants | Afghanistan | 58.2 /100 | #168 | Average 46.8% |
| Armenians | 58.2 /100 | #169 | Average 46.8% |
| Immigrants | Latvia | 56.7 /100 | #170 | Average 46.7% |
| Immigrants | Zimbabwe | 52.4 /100 | #171 | Average 46.7% |
| Aleuts | 52.0 /100 | #172 | Average 46.7% |
| Tlingit-Haida | 51.2 /100 | #173 | Average 46.7% |
| Peruvians | 50.0 /100 | #174 | Average 46.6% |
| Immigrants | Brazil | 49.9 /100 | #175 | Average 46.6% |
Demographics Similar to Sudanese by Currently Married
In terms of currently married, the demographic groups most similar to Sudanese are Immigrants from Cuba (43.7%, a difference of 0.010%), Bangladeshi (43.7%, a difference of 0.050%), Immigrants from Bangladesh (43.6%, a difference of 0.080%), Ecuadorian (43.6%, a difference of 0.15%), and Immigrants from Eritrea (43.6%, a difference of 0.18%).
| Demographics | Rating | Rank | Currently Married |
| Immigrants | Africa | 0.2 /100 | #257 | Tragic 43.9% |
| Ute | 0.2 /100 | #258 | Tragic 43.9% |
| Immigrants | Sierra Leone | 0.1 /100 | #259 | Tragic 43.8% |
| Immigrants | Latin America | 0.1 /100 | #260 | Tragic 43.8% |
| Immigrants | Nicaragua | 0.1 /100 | #261 | Tragic 43.7% |
| Bangladeshis | 0.1 /100 | #262 | Tragic 43.7% |
| Immigrants | Cuba | 0.1 /100 | #263 | Tragic 43.7% |
| Sudanese | 0.1 /100 | #264 | Tragic 43.7% |
| Immigrants | Bangladesh | 0.1 /100 | #265 | Tragic 43.6% |
| Ecuadorians | 0.1 /100 | #266 | Tragic 43.6% |
| Immigrants | Eritrea | 0.1 /100 | #267 | Tragic 43.6% |
| Spanish American Indians | 0.1 /100 | #268 | Tragic 43.6% |
| Immigrants | Sudan | 0.1 /100 | #269 | Tragic 43.5% |
| Salvadorans | 0.1 /100 | #270 | Tragic 43.5% |
| Bermudans | 0.1 /100 | #271 | Tragic 43.5% |