Guatemalan vs Immigrants from Venezuela Family Households with Children
COMPARE
Guatemalan
Immigrants from Venezuela
Family Households with Children
Family Households with Children Comparison
Guatemalans
Immigrants from Venezuela
28.9%
FAMILY HOUSEHOLDS WITH CHILDREN
100.0/ 100
METRIC RATING
52nd/ 347
METRIC RANK
29.3%
FAMILY HOUSEHOLDS WITH CHILDREN
100.0/ 100
METRIC RATING
36th/ 347
METRIC RANK
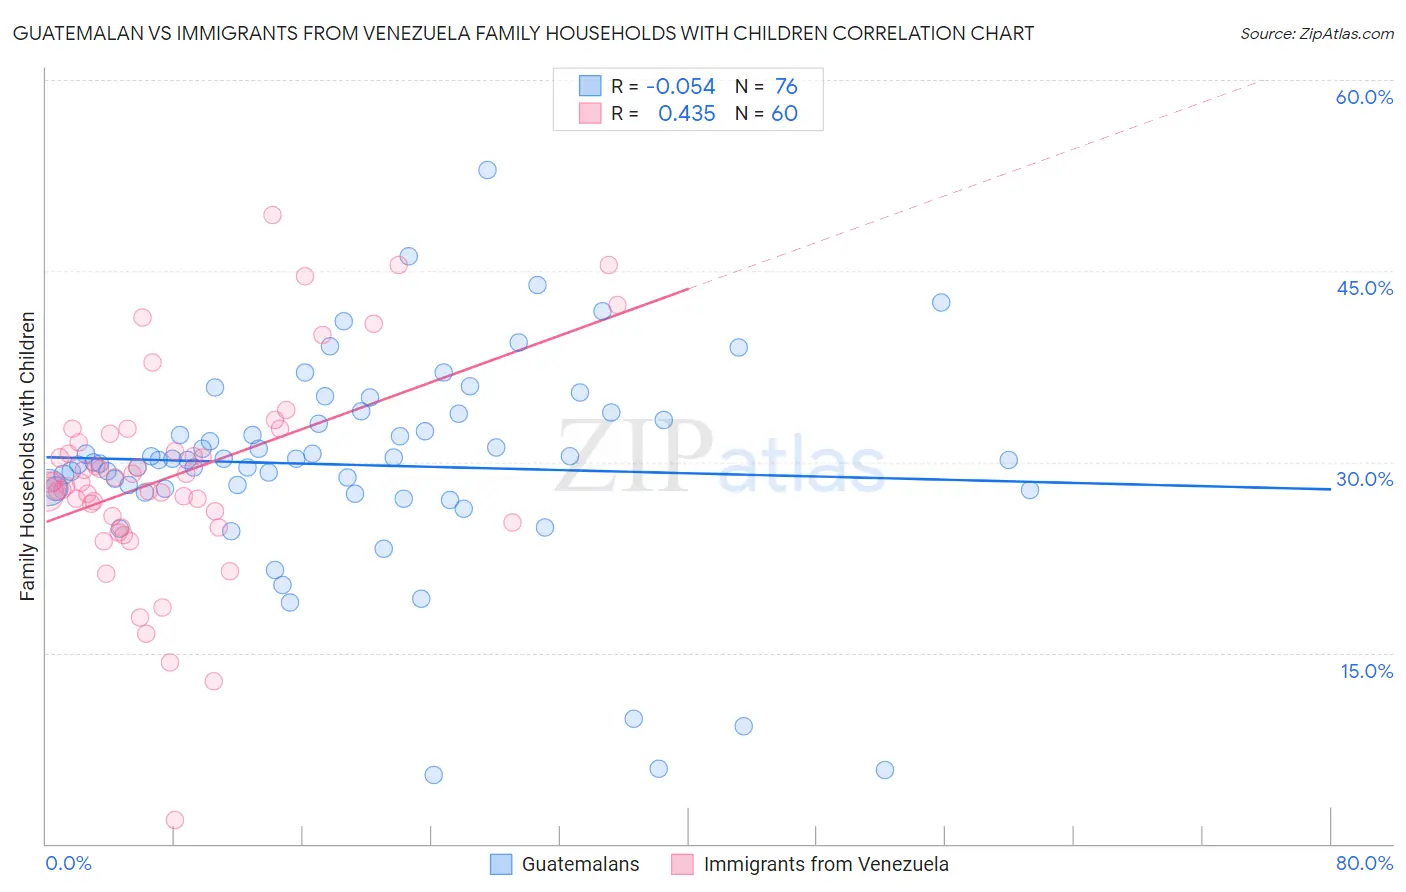
Guatemalan vs Immigrants from Venezuela Family Households with Children Correlation Chart
The statistical analysis conducted on geographies consisting of 409,222,746 people shows a slight negative correlation between the proportion of Guatemalans and percentage of family households with children in the United States with a correlation coefficient (R) of -0.054 and weighted average of 28.9%. Similarly, the statistical analysis conducted on geographies consisting of 287,735,814 people shows a moderate positive correlation between the proportion of Immigrants from Venezuela and percentage of family households with children in the United States with a correlation coefficient (R) of 0.435 and weighted average of 29.3%, a difference of 1.4%.
Family Households with Children Correlation Summary
| Measurement | Guatemalan | Immigrants from Venezuela |
| Minimum | 5.4% | 1.9% |
| Maximum | 52.9% | 49.4% |
| Range | 47.5% | 47.5% |
| Mean | 29.8% | 28.9% |
| Median | 30.1% | 28.4% |
| Interquartile 25% (IQ1) | 27.8% | 25.5% |
| Interquartile 75% (IQ3) | 33.5% | 31.9% |
| Interquartile Range (IQR) | 5.7% | 6.4% |
| Standard Deviation (Sample) | 8.3% | 8.1% |
| Standard Deviation (Population) | 8.3% | 8.1% |
Demographics Similar to Guatemalans and Immigrants from Venezuela by Family Households with Children
In terms of family households with children, the demographic groups most similar to Guatemalans are Immigrants from Cambodia (28.9%, a difference of 0.070%), Immigrants from Peru (28.9%, a difference of 0.080%), Immigrants (28.9%, a difference of 0.11%), Sierra Leonean (28.9%, a difference of 0.15%), and Jordanian (29.0%, a difference of 0.22%). Similarly, the demographic groups most similar to Immigrants from Venezuela are Immigrants from Sierra Leone (29.3%, a difference of 0.010%), Immigrants from Bolivia (29.3%, a difference of 0.17%), Immigrants from Cameroon (29.2%, a difference of 0.27%), Korean (29.2%, a difference of 0.41%), and Yaqui (29.1%, a difference of 0.56%).
| Demographics | Rating | Rank | Family Households with Children |
| Immigrants | Bolivia | 100.0 /100 | #34 | Exceptional 29.3% |
| Immigrants | Sierra Leone | 100.0 /100 | #35 | Exceptional 29.3% |
| Immigrants | Venezuela | 100.0 /100 | #36 | Exceptional 29.3% |
| Immigrants | Cameroon | 100.0 /100 | #37 | Exceptional 29.2% |
| Koreans | 100.0 /100 | #38 | Exceptional 29.2% |
| Yaqui | 100.0 /100 | #39 | Exceptional 29.1% |
| Central Americans | 100.0 /100 | #40 | Exceptional 29.1% |
| Immigrants | South Eastern Asia | 100.0 /100 | #41 | Exceptional 29.1% |
| Spanish American Indians | 100.0 /100 | #42 | Exceptional 29.1% |
| Asians | 100.0 /100 | #43 | Exceptional 29.1% |
| Immigrants | Taiwan | 100.0 /100 | #44 | Exceptional 29.0% |
| Fijians | 100.0 /100 | #45 | Exceptional 29.0% |
| Immigrants | Philippines | 100.0 /100 | #46 | Exceptional 29.0% |
| Peruvians | 100.0 /100 | #47 | Exceptional 29.0% |
| Apache | 100.0 /100 | #48 | Exceptional 29.0% |
| Jordanians | 100.0 /100 | #49 | Exceptional 29.0% |
| Immigrants | Immigrants | 100.0 /100 | #50 | Exceptional 28.9% |
| Immigrants | Peru | 100.0 /100 | #51 | Exceptional 28.9% |
| Guatemalans | 100.0 /100 | #52 | Exceptional 28.9% |
| Immigrants | Cambodia | 100.0 /100 | #53 | Exceptional 28.9% |
| Sierra Leoneans | 100.0 /100 | #54 | Exceptional 28.9% |