Immigrants from Russia vs Immigrants from Sweden Currently Married
COMPARE
Immigrants from Russia
Immigrants from Sweden
Currently Married
Currently Married Comparison
Immigrants from Russia
Immigrants from Sweden
47.7%
CURRENTLY MARRIED
92.0/ 100
METRIC RATING
110th/ 347
METRIC RANK
47.8%
CURRENTLY MARRIED
94.3/ 100
METRIC RATING
99th/ 347
METRIC RANK
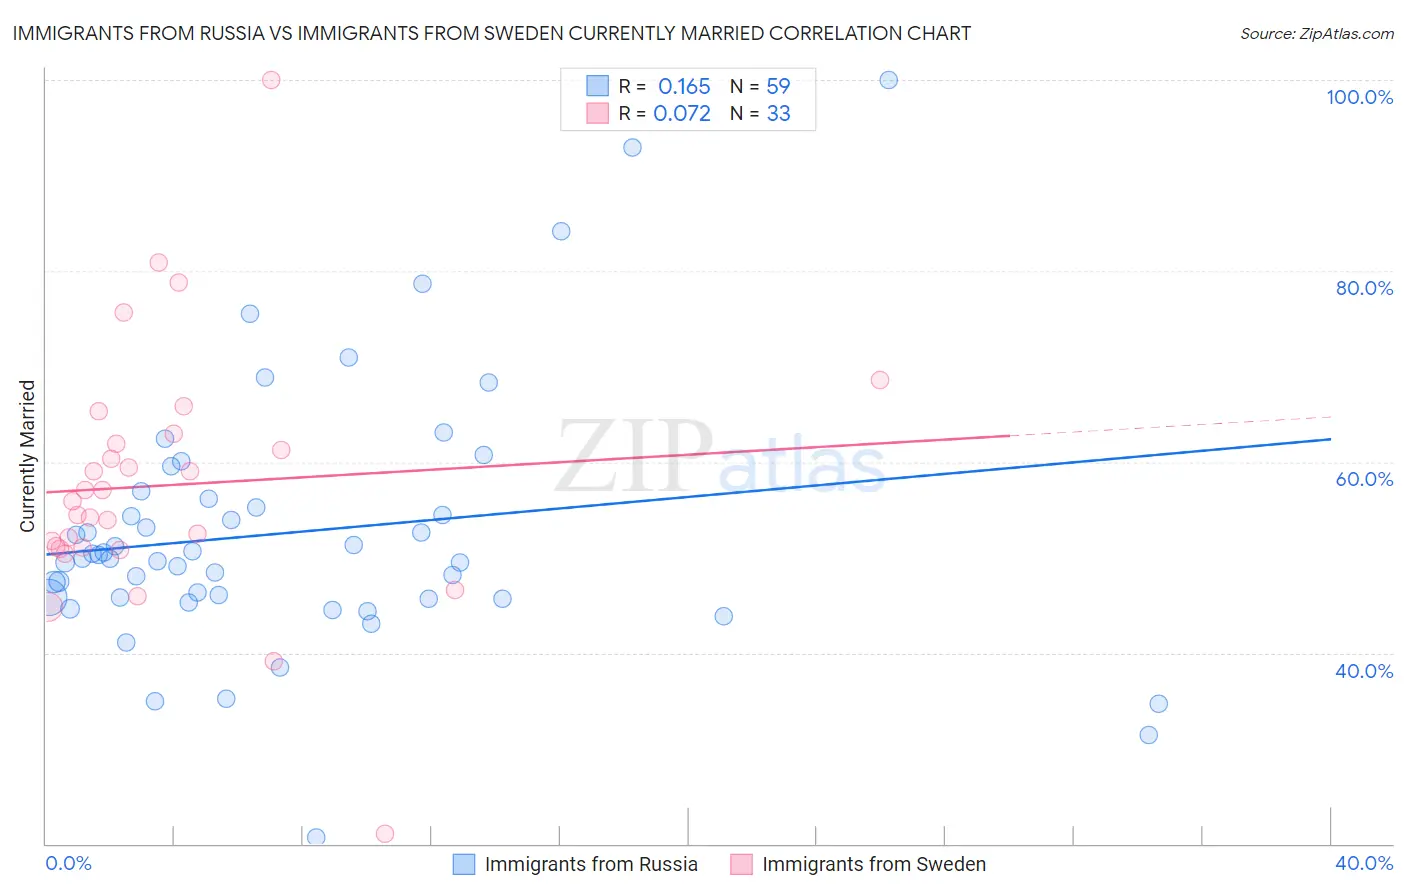
Immigrants from Russia vs Immigrants from Sweden Currently Married Correlation Chart
The statistical analysis conducted on geographies consisting of 347,902,051 people shows a poor positive correlation between the proportion of Immigrants from Russia and percentage of population currently married in the United States with a correlation coefficient (R) of 0.165 and weighted average of 47.7%. Similarly, the statistical analysis conducted on geographies consisting of 164,728,408 people shows a slight positive correlation between the proportion of Immigrants from Sweden and percentage of population currently married in the United States with a correlation coefficient (R) of 0.072 and weighted average of 47.8%, a difference of 0.32%.
Currently Married Correlation Summary
| Measurement | Immigrants from Russia | Immigrants from Sweden |
| Minimum | 20.6% | 21.1% |
| Maximum | 100.0% | 100.0% |
| Range | 79.4% | 78.9% |
| Mean | 52.6% | 57.6% |
| Median | 49.9% | 55.9% |
| Interquartile 25% (IQ1) | 45.6% | 51.0% |
| Interquartile 75% (IQ3) | 56.2% | 62.4% |
| Interquartile Range (IQR) | 10.6% | 11.5% |
| Standard Deviation (Sample) | 13.7% | 13.6% |
| Standard Deviation (Population) | 13.6% | 13.4% |
Demographics Similar to Immigrants from Russia and Immigrants from Sweden by Currently Married
In terms of currently married, the demographic groups most similar to Immigrants from Russia are Immigrants from Egypt (47.7%, a difference of 0.040%), Tsimshian (47.7%, a difference of 0.050%), Immigrants from Hungary (47.6%, a difference of 0.090%), Immigrants from Western Europe (47.6%, a difference of 0.10%), and Immigrants from Italy (47.7%, a difference of 0.11%). Similarly, the demographic groups most similar to Immigrants from Sweden are Celtic (47.8%, a difference of 0.020%), Immigrants from Germany (47.8%, a difference of 0.040%), Turkish (47.8%, a difference of 0.060%), Immigrants from China (47.9%, a difference of 0.080%), and Immigrants from Ukraine (47.9%, a difference of 0.090%).
| Demographics | Rating | Rank | Currently Married |
| Native Hawaiians | 95.0 /100 | #94 | Exceptional 47.9% |
| Immigrants | Bulgaria | 94.8 /100 | #95 | Exceptional 47.9% |
| Egyptians | 94.8 /100 | #96 | Exceptional 47.9% |
| Immigrants | Ukraine | 94.8 /100 | #97 | Exceptional 47.9% |
| Immigrants | China | 94.7 /100 | #98 | Exceptional 47.9% |
| Immigrants | Sweden | 94.3 /100 | #99 | Exceptional 47.8% |
| Celtics | 94.2 /100 | #100 | Exceptional 47.8% |
| Immigrants | Germany | 94.1 /100 | #101 | Exceptional 47.8% |
| Turks | 93.9 /100 | #102 | Exceptional 47.8% |
| Cypriots | 93.7 /100 | #103 | Exceptional 47.8% |
| Serbians | 93.6 /100 | #104 | Exceptional 47.8% |
| Immigrants | Singapore | 93.3 /100 | #105 | Exceptional 47.8% |
| Immigrants | Greece | 93.1 /100 | #106 | Exceptional 47.7% |
| Immigrants | Italy | 92.9 /100 | #107 | Exceptional 47.7% |
| Tsimshian | 92.4 /100 | #108 | Exceptional 47.7% |
| Immigrants | Egypt | 92.3 /100 | #109 | Exceptional 47.7% |
| Immigrants | Russia | 92.0 /100 | #110 | Exceptional 47.7% |
| Immigrants | Hungary | 91.2 /100 | #111 | Exceptional 47.6% |
| Immigrants | Western Europe | 91.1 /100 | #112 | Exceptional 47.6% |
| Immigrants | Denmark | 90.9 /100 | #113 | Exceptional 47.6% |
| South Africans | 90.5 /100 | #114 | Exceptional 47.6% |